Honeywell 2011 Annual Report Download - page 105
Download and view the complete annual report
Please find page 105 of the 2011 Honeywell annual report below. You can navigate through the pages in the report by either clicking on the pages listed below, or by using the keyword search tool below to find specific information within the annual report.-
 1
1 -
2
-
3
-
4
-
5
-
6
-
7
-
8
-
9
-
10
-
11
-
12
-
13
-
14
-
15
-
16
-
17
-
18
-
19
-
20
-
21
-
22
-
23
-
24
-
25
-
26
-
27
-
28
-
29
-
30
-
31
-
32
-
33
-
34
-
35
-
36
-
37
-
38
-
39
-
40
-
41
-
42
-
43
-
44
-
45
-
46
-
47
-
48
-
49
-
50
-
51
-
52
-
53
-
54
-
55
-
56
-
57
-
58
-
59
-
60
-
61
-
62
-
63
-
64
-
65
-
66
-
67
-
68
-
69
-
70
-
71
-
72
-
73
-
74
-
75
-
76
-
77
-
78
-
79
-
80
-
81
-
82
-
83
-
84
-
85
-
86
-
87
-
88
-
89
-
90
-
91
-
92
-
93
-
94
-
 95
95 -
 96
96 -
 97
97 -
 98
98 -
 99
99 -
 100
100 -
 101
101 -
 102
102 -
 103
103 -
 104
104 -
 105
105 -
 106
106 -
 107
107 -
 108
108 -
 109
109 -
 110
110 -
 111
111 -
 112
112 -
 113
113 -
 114
114 -
 115
115 -
116
-
117
-
118
-
119
-
120
-
121
-
122
-
123
-
124
-
125
-
126
-
127
-
128
-
129
-
130
-
131
-
132
-
133
-
134
-
135
-
136
-
137
-
138
-
139
-
140
-
141
-
142
-
143
-
144
-
145
-
146
-
147
-
148
-
149
-
150
-
151
-
152
-
153
-
154
-
155
-
156
-
157
-
158
-
159
 |
 |

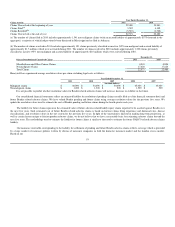
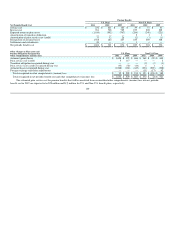
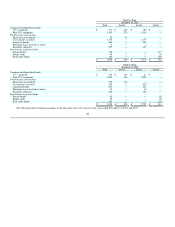
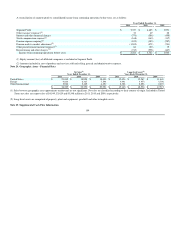
Other Postretirement Benefits
2011 2010 2009
Actuarial assumptions used to determine benefit obligations as of December 31:
Discount rate 4.00% 4.70% 5.25%
Actuarial assumptions used to determine net periodic benefit cost for years ended December 31:
Discount rate 4.70% 5.25% 6.00%
The discount rate for our U.S. pension and other postretirement benefits plans reflects the current rate at which the associated liabilities could be settled
at the measurement date of December 31. To determine discount rates for our U.S. pension and other postretirement benefit plans, we use a modeling process
that involves matching the expected cash outflows of our benefit plans to a yield curve constructed from a portfolio of high quality, fixed-income debt
instruments. We use the average yield of this hypothetical portfolio as a discount rate benchmark. The discount rate used to determine the other postretirement
benefit obligation is lower principally due to a shorter expected duration of other postretirement plan obligations as compared to pension plan obligations.
Our expected rate of return on U.S. plan assets of 8 percent is a long-term rate based on historical plan asset returns over varying long-term periods
combined with our expectations on future market conditions and the asset mix of the plan's investments. We review the expected rate of return on an annual
basis and revise it as appropriate.
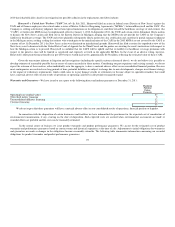
For non-U.S. benefit plans, none of which was individually material, assumptions reflect economic assumptions applicable to each country.
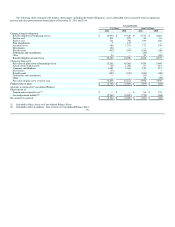
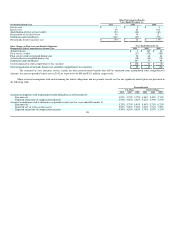
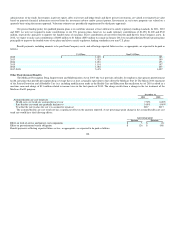
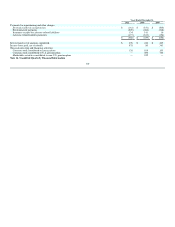
Pension Benefits
Included in the aggregate data in the tables above are the amounts applicable to our pension plans with accumulated benefit obligations exceeding the
fair value of plan assets. Amounts related to such plans were as follows:
December 31,
U.S. Plans Non-U.S. Plans
2011 2010 2011 2010
Projected benefit obligation $ 15,600 $ 14,990 $ 4,141 $ 1,990
Accumulated benefit obligation $ 14,845 $ 14,260 $ 3,912 $ 1,883
Fair value of plan assets $ 12,836 $ 12,181 $ 3,367 $ 1,474
Accumulated benefit obligation for our U.S. defined benefit pension plans were $14.8 and $14.3 billion and our Non-U.S. defined benefit plans were
$4.4 and $4.1 billion at December 31, 2011 and 2010, respectively.
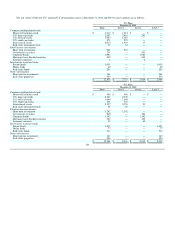
Our asset investment strategy for our U.S. pension plans focuses on maintaining a diversified portfolio using various asset classes in order to achieve
our long-term investment objectives on a risk adjusted basis. Our actual invested positions in various securities change over time based on short and longer-
term investment opportunities. To achieve our objectives, we have established long-term target allocations as follows: 60-70 percent equity securities, 10-20
percent fixed income securities and cash, 5-15 percent real estate investments, and 10-20 percent other types of investments. Equity securities include
publicly-traded stock of companies located both inside and outside the United States. Fixed income securities include corporate bonds of companies from
diversified industries, mortgage-backed securities, and U.S. Treasuries. Real estate investments include direct investments in commercial properties and
investments in real estate funds. Other types of investments include investments in private equity and hedge funds that follow several different strategies. We
review our assets on a regular basis to ensure that we are within the targeted asset allocation ranges and, if necessary, asset balances are adjusted back within
target allocations.
Our non-U.S. pension assets are typically managed by decentralized fiduciary committees with the Honeywell Corporate Investments group providing
standard funding and investment guidance. Local regulations, local funding rules, and local financial and tax considerations are part of the funding and
investment allocation process in each country. While our non-U.S. investment policies are different for each country, the long-term investment objectives are
generally the same as those for the U.S. pension assets.
102