Honeywell 2011 Annual Report Download - page 35
Download and view the complete annual report
Please find page 35 of the 2011 Honeywell annual report below. You can navigate through the pages in the report by either clicking on the pages listed below, or by using the keyword search tool below to find specific information within the annual report.-
 1
1 -
2
-
3
-
4
-
5
-
6
-
7
-
8
-
9
-
10
-
11
-
12
-
13
-
14
-
15
-
16
-
17
-
18
-
19
-
20
-
21
-
22
-
23
-
24
-
 25
25 -
 26
26 -
 27
27 -
 28
28 -
 29
29 -
 30
30 -
 31
31 -
 32
32 -
 33
33 -
 34
34 -
 35
35 -
 36
36 -
 37
37 -
 38
38 -
 39
39 -
 40
40 -
 41
41 -
 42
42 -
 43
43 -
 44
44 -
 45
45 -
46
-
47
-
48
-
49
-
50
-
51
-
52
-
53
-
54
-
55
-
56
-
57
-
58
-
59
-
60
-
61
-
62
-
63
-
64
-
65
-
66
-
67
-
68
-
69
-
70
-
71
-
72
-
73
-
74
-
75
-
76
-
77
-
78
-
79
-
80
-
81
-
82
-
83
-
84
-
85
-
86
-
87
-
88
-
89
-
90
-
91
-
92
-
93
-
94
-
95
-
96
-
97
-
98
-
99
-
100
-
101
-
102
-
103
-
104
-
105
-
106
-
107
-
108
-
109
-
110
-
111
-
112
-
113
-
114
-
115
-
116
-
117
-
118
-
119
-
120
-
121
-
122
-
123
-
124
-
125
-
126
-
127
-
128
-
129
-
130
-
131
-
132
-
133
-
134
-
135
-
136
-
137
-
138
-
139
-
140
-
141
-
142
-
143
-
144
-
145
-
146
-
147
-
148
-
149
-
150
-
151
-
152
-
153
-
154
-
155
-
156
-
157
-
158
-
159
 |
 |

% Change
2011 2010 2009
2011
Versus
2010
2010
Versus
2009
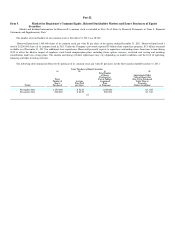
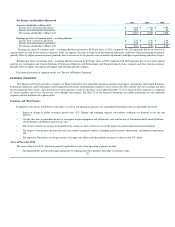
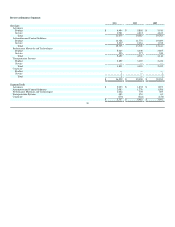
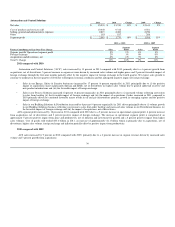
Aerospace Sales
Commercial:
Air transport and regional
Original equipment $ 1,439 $ 1,362 $ 1,396 6% (2)%
Aftermarket 2,828 2,437 2,419 16% 1%
Business and general aviation
Original equipment 723 513 709 41% (28)%
Aftermarket 1,207 976 902 24% 8%
Defense and Space Sales 5,278 5,395 5,337 (2)% 1%
Total Aerospace Sales 11,475 10,683 10,763
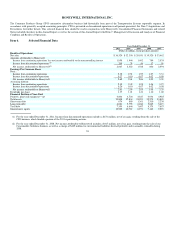
Automation and Control Solutions Sales
Energy Safety & Security 7,977 6,789 5,932 17% 14%
Process Solutions 3,010 2,678 2,507 12% 7%
Building Solutions & Distribution 4,548 4,282 4,172 6% 3%
Total Automation and Control Solutions Sales 15,535 13,749 12,611
Performance Materials and Technologies Sales
UOP 1,931 1,556 1,574 24% (1)%
Advanced Materials 3,728 3,170 2,570 18% 23%
Total Performance Materials and Technologies Sales 5,659 4,726 4,144
Transportation Systems Sales
Turbo Technologies 3,859 3,192 2,432 21% 31%
Total Transportation Systems Sales 3,859 3,192 2,432
Corporate 1 — 1
Net Sales $ 36,529 32,350 29,951
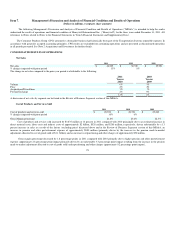
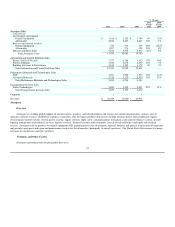
Aerospace
Overview
Aerospace is a leading global supplier of aircraft engines, avionics, and related products and services for aircraft manufacturers, airlines, aircraft
operators, military services, and defense and space contractors. Our Aerospace products and services include auxiliary power units, propulsion engines,
environmental control systems, electric power systems, engine controls, flight safety, communications, navigation, radar and surveillance systems, aircraft
lighting, management and technical services, logistics services, advanced systems and instruments, aircraft wheels and brakes and repair and overhaul
services. Aerospace sells its products to original equipment (OE) manufacturers in the air transport, regional, business and general aviation aircraft segments,
and provides spare parts and repair and maintenance services for the aftermarket (principally to aircraft operators). The United States Government is a major
customer for our defense and space products.
Economic and Other Factors
Aerospace operating results are principally driven by:
32