Honeywell 2011 Annual Report Download - page 112
Download and view the complete annual report
Please find page 112 of the 2011 Honeywell annual report below. You can navigate through the pages in the report by either clicking on the pages listed below, or by using the keyword search tool below to find specific information within the annual report.-
 1
1 -
2
-
3
-
4
-
5
-
6
-
7
-
8
-
9
-
10
-
11
-
12
-
13
-
14
-
15
-
16
-
17
-
18
-
19
-
20
-
21
-
22
-
23
-
24
-
25
-
26
-
27
-
28
-
29
-
30
-
31
-
32
-
33
-
34
-
35
-
36
-
37
-
38
-
39
-
40
-
41
-
42
-
43
-
44
-
45
-
46
-
47
-
48
-
49
-
50
-
51
-
52
-
53
-
54
-
55
-
56
-
57
-
58
-
59
-
60
-
61
-
62
-
63
-
64
-
65
-
66
-
67
-
68
-
69
-
70
-
71
-
72
-
73
-
74
-
75
-
76
-
77
-
78
-
79
-
80
-
81
-
82
-
83
-
84
-
85
-
86
-
87
-
88
-
89
-
90
-
91
-
92
-
93
-
94
-
95
-
96
-
97
-
98
-
99
-
100
-
101
-
 102
102 -
 103
103 -
 104
104 -
 105
105 -
 106
106 -
 107
107 -
 108
108 -
 109
109 -
 110
110 -
 111
111 -
 112
112 -
 113
113 -
 114
114 -
 115
115 -
 116
116 -
 117
117 -
 118
118 -
 119
119 -
 120
120 -
 121
121 -
 122
122 -
123
-
124
-
125
-
126
-
127
-
128
-
129
-
130
-
131
-
132
-
133
-
134
-
135
-
136
-
137
-
138
-
139
-
140
-
141
-
142
-
143
-
144
-
145
-
146
-
147
-
148
-
149
-
150
-
151
-
152
-
153
-
154
-
155
-
156
-
157
-
158
-
159
 |
 |

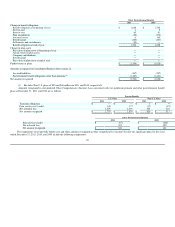
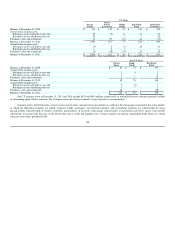
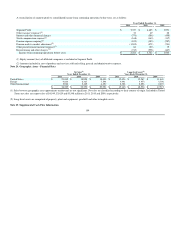
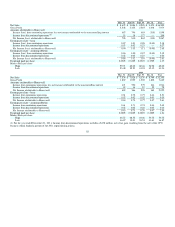
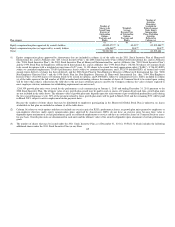
A reconciliation of segment profit to consolidated income from continuing operations before taxes are as follows:
Years Ended December 31,
2011 2010 2009
Segment Profit $ 5,357 $ 4,485 $ 3,991
Other income/ (expense)(1) 33 69 28
Interest and other financial charges (376) (386) (458)
Stock compensation expense(2) (168) (163) (117)
Pension expense-ongoing(2) (105) (185) (287)
Pension mark-to-market adjustment(2) (1,802) (471) (741)
Other postretirement income/(expense)(2) 86 (29) 15
Repositioning and other charges (2) (743) (598) (467)
Income from continuing operations before taxes $ 2,282 $ 2,722 $ 1,964
(1) Equity income/(loss) of affiliated companies is included in Segment Profit.
(2) Amounts included in cost of products and services sold and selling, general and administrative expenses.
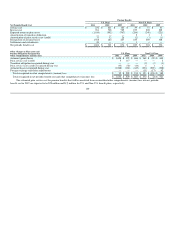
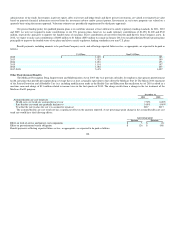
Note 24. Geographic Areas - Financial Data
Net Sales(1) Long-lived Assets(2)
Years Ended December 31, Years Ended December 31,
2011 2010 2009 2011 2010 2009
United States $ 21,005 $ 18,858 $ 18,000 $ 12,426 $ 12,267 $ 11,645
Europe 9,604 8,367 7,594 3,991 3,973 3,798
Other International 5,920 5,125 4,357 2,728 2,296 2,072
$ 36,529 $ 32,350 $ 29,951 $ 19,145 $ 18,536 $ 17,515
(1) Sales between geographic areas approximate market and are not significant. Net sales are classified according to their country of origin. Included in United
States net sales are export sales of $4,549, $3,629 and $3,548 million in 2011, 2010 and 2009, respectively.
(2) Long-lived assets are comprised of property, plant and equipment, goodwill and other intangible assets.
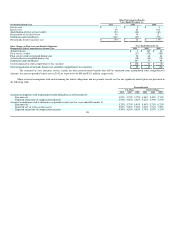
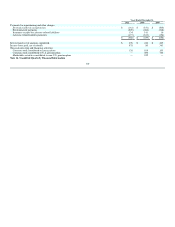
Note 25. Supplemental Cash Flow Information
109