Honeywell 2011 Annual Report Download - page 28
Download and view the complete annual report
Please find page 28 of the 2011 Honeywell annual report below. You can navigate through the pages in the report by either clicking on the pages listed below, or by using the keyword search tool below to find specific information within the annual report.-
 1
1 -
2
-
3
-
4
-
5
-
6
-
7
-
8
-
9
-
10
-
11
-
12
-
13
-
14
-
15
-
16
-
17
-
 18
18 -
 19
19 -
 20
20 -
 21
21 -
 22
22 -
 23
23 -
 24
24 -
 25
25 -
 26
26 -
 27
27 -
 28
28 -
 29
29 -
 30
30 -
 31
31 -
 32
32 -
 33
33 -
 34
34 -
 35
35 -
 36
36 -
 37
37 -
 38
38 -
39
-
40
-
41
-
42
-
43
-
44
-
45
-
46
-
47
-
48
-
49
-
50
-
51
-
52
-
53
-
54
-
55
-
56
-
57
-
58
-
59
-
60
-
61
-
62
-
63
-
64
-
65
-
66
-
67
-
68
-
69
-
70
-
71
-
72
-
73
-
74
-
75
-
76
-
77
-
78
-
79
-
80
-
81
-
82
-
83
-
84
-
85
-
86
-
87
-
88
-
89
-
90
-
91
-
92
-
93
-
94
-
95
-
96
-
97
-
98
-
99
-
100
-
101
-
102
-
103
-
104
-
105
-
106
-
107
-
108
-
109
-
110
-
111
-
112
-
113
-
114
-
115
-
116
-
117
-
118
-
119
-
120
-
121
-
122
-
123
-
124
-
125
-
126
-
127
-
128
-
129
-
130
-
131
-
132
-
133
-
134
-
135
-
136
-
137
-
138
-
139
-
140
-
141
-
142
-
143
-
144
-
145
-
146
-
147
-
148
-
149
-
150
-
151
-
152
-
153
-
154
-
155
-
156
-
157
-
158
-
159
 |
 |

Item 7. Management's Discussion and Analysis of Financial Condition and Results of Operations
(Dollars in millions, except per share amounts)
The following Management's Discussion and Analysis of Financial Condition and Results of Operations ("MD&A") is intended to help the reader
understand the results of operations and financial condition of Honeywell International Inc. ("Honeywell") for the three years ended December 31, 2011. All
references to Notes related to Notes to the Financial Statements in "Item 8-Financial Statements and Supplementary Data".
The Consumer Products Group (CPG) automotive aftermarket business had historically been part of the Transportation Systems reportable segment. In
accordance with generally accepted accounting principles, CPG results are excluded from continuing operations and are presented as discontinued operations
in all periods presented. See Note 2 Acquisitions and Divestitures for further details.
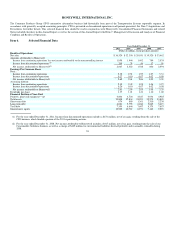
CONSOLIDATED RESULTS OF OPERATIONS
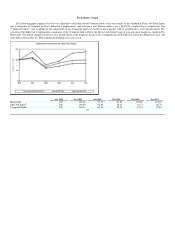
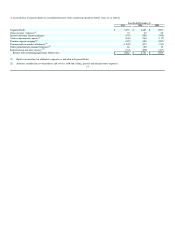
Net Sales
2011 2010 2009
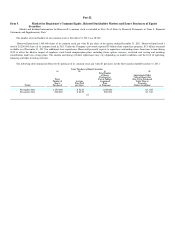
Net sales $ 36,529 $ 32,350 $ 29,951
% change compared with prior period 13% 8%
The change in net sales compared to the prior year period is attributable to the following:
2011
Versus
2010
2010
Versus
2009
Volume 6% 5%
Price 2% 2%
Acquisitions/Divestitures 3% 1%
Foreign Exchange 2% 0%
13% 8%
A discussion of net sales by segment can be found in the Review of Business Segments section of this MD&A.
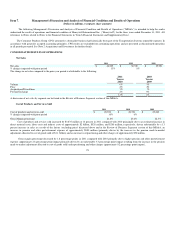
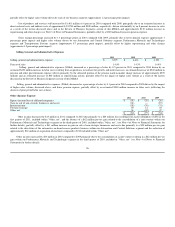
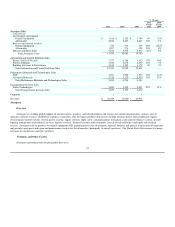
Cost of Products and Services Sold
2011 2010 2009
Cost of products and services sold $ 28,556 $ 24,721 $ 23,260
% change compared with prior period 16% 6%
Gross Margin percentage 21.8% 23.6% 22.3%
Cost of products and services sold increased by $3,835 million or 16 percent in 2011 compared with 2010 principally due to an estimated increase in
direct material costs, labor costs and indirect costs of approximately $2 billion, $520 million, and $280 million, respectively, driven substantially by a 13
percent increase in sales as a result of the factors (excluding price) discussed above and in the Review of Business Segments section of this MD&A, an
increase in pension and other postretirement expense of approximately $880 million (primarily driven by the increase in the pension mark-to-market
adjustment allocated to cost of goods sold of $1.1 billion) and an increase in repositioning and other charges of approximately $90 million.
Gross margin percentage decreased by 1.8 percentage points in 2011 compared with 2010 primarily due to higher pension and other postretirement
expense (approximate 2.8 percentage point impact primarily driven by an unfavorable 3.3 percentage point impact resulting from the increase in the pension
mark-to-market adjustment allocated to cost of goods sold) and repositioning and other charges (approximate 0.2 percentage point impact),
25