Honeywell 2011 Annual Report Download - page 78
Download and view the complete annual report
Please find page 78 of the 2011 Honeywell annual report below. You can navigate through the pages in the report by either clicking on the pages listed below, or by using the keyword search tool below to find specific information within the annual report.-
 1
1 -
2
-
3
-
4
-
5
-
6
-
7
-
8
-
9
-
10
-
11
-
12
-
13
-
14
-
15
-
16
-
17
-
18
-
19
-
20
-
21
-
22
-
23
-
24
-
25
-
26
-
27
-
28
-
29
-
30
-
31
-
32
-
33
-
34
-
35
-
36
-
37
-
38
-
39
-
40
-
41
-
42
-
43
-
44
-
45
-
46
-
47
-
48
-
49
-
50
-
51
-
52
-
53
-
54
-
55
-
56
-
57
-
58
-
59
-
60
-
61
-
62
-
63
-
64
-
65
-
66
-
67
-
 68
68 -
 69
69 -
 70
70 -
 71
71 -
 72
72 -
 73
73 -
 74
74 -
 75
75 -
 76
76 -
 77
77 -
 78
78 -
 79
79 -
 80
80 -
 81
81 -
 82
82 -
 83
83 -
 84
84 -
 85
85 -
 86
86 -
 87
87 -
 88
88 -
89
-
90
-
91
-
92
-
93
-
94
-
95
-
96
-
97
-
98
-
99
-
100
-
101
-
102
-
103
-
104
-
105
-
106
-
107
-
108
-
109
-
110
-
111
-
112
-
113
-
114
-
115
-
116
-
117
-
118
-
119
-
120
-
121
-
122
-
123
-
124
-
125
-
126
-
127
-
128
-
129
-
130
-
131
-
132
-
133
-
134
-
135
-
136
-
137
-
138
-
139
-
140
-
141
-
142
-
143
-
144
-
145
-
146
-
147
-
148
-
149
-
150
-
151
-
152
-
153
-
154
-
155
-
156
-
157
-
158
-
159
 |
 |

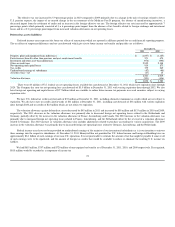
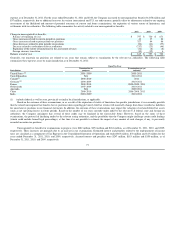
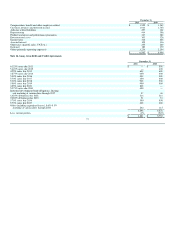
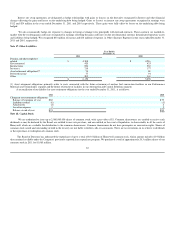
Trade Receivables includes $1,404, and $1,307 million of unbilled balances under long-term contracts as of December 31, 2011 and December 31,
2010, respectively. These amounts are billed in accordance with the terms of customer contracts to which they relate.
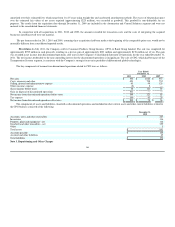
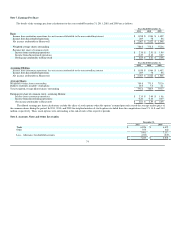
Note 9. Inventories
December 31,
2011 2010
Raw materials $ 1,222 $ 1,139
Work in process 958 792
Finished products 2,253 2,045
4,433 3,976
Reduction to LIFO cost basis (169) (154)
$ 4,264 $ 3,822
Inventories valued at LIFO amounted to $302 and $198 million at December 31, 2011 and 2010, respectively. Had such LIFO inventories been valued
at current costs, their carrying values would have been approximately $169 and $154 million higher at December 31, 2011 and 2010, respectively.
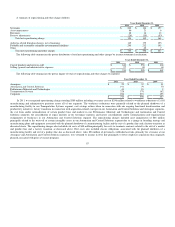
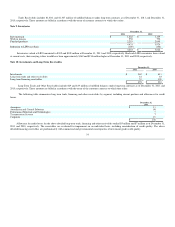
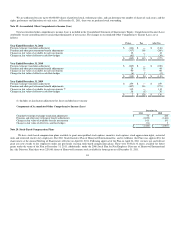
Note 10. Investments and Long-Term Receivables
December 31,
2011 2010
Investments $ 362 $ 413
Long-term trade and other receivables 81 83
Long-term financing receivables 51 120
$ 494 $ 616
Long-Term Trade and Other Receivables include $29 and $19 million of unbilled balances under long-term contracts as of December 31, 2011 and
2010, respectively. These amounts are billed in accordance with the terms of the customer contracts to which they relate.
The following table summarizes long term trade, financing and other receivables by segment, including current portions and allowances for credit
losses.
December 31,
2011
Aerospace $ 13
Automation and Control Solutions 90
Performance Materials and Technologies 7
Transportation Systems 7
Corporate 19
$ 136
Allowance for credit losses for the above detailed long-term trade, financing and other receivables totaled $5 million and $7 million as of December 31,
2011 and 2010, respectively. The receivables are evaluated for impairment on an individual basis, including consideration of credit quality. The above
detailed financing receivables are predominately with commercial and governmental counterparties of investment grade credit quality.
75