Honeywell 2011 Annual Report Download - page 13
Download and view the complete annual report
Please find page 13 of the 2011 Honeywell annual report below. You can navigate through the pages in the report by either clicking on the pages listed below, or by using the keyword search tool below to find specific information within the annual report.-
 1
1 -
2
-
 3
3 -
 4
4 -
 5
5 -
 6
6 -
 7
7 -
 8
8 -
 9
9 -
 10
10 -
 11
11 -
 12
12 -
 13
13 -
 14
14 -
 15
15 -
 16
16 -
 17
17 -
 18
18 -
 19
19 -
 20
20 -
 21
21 -
 22
22 -
 23
23 -
24
-
25
-
26
-
27
-
28
-
29
-
30
-
31
-
32
-
33
-
34
-
35
-
36
-
37
-
38
-
39
-
40
-
41
-
42
-
43
-
44
-
45
-
46
-
47
-
48
-
49
-
50
-
51
-
52
-
53
-
54
-
55
-
56
-
57
-
58
-
59
-
60
-
61
-
62
-
63
-
64
-
65
-
66
-
67
-
68
-
69
-
70
-
71
-
72
-
73
-
74
-
75
-
76
-
77
-
78
-
79
-
80
-
81
-
82
-
83
-
84
-
85
-
86
-
87
-
88
-
89
-
90
-
91
-
92
-
93
-
94
-
95
-
96
-
97
-
98
-
99
-
100
-
101
-
102
-
103
-
104
-
105
-
106
-
107
-
108
-
109
-
110
-
111
-
112
-
113
-
114
-
115
-
116
-
117
-
118
-
119
-
120
-
121
-
122
-
123
-
124
-
125
-
126
-
127
-
128
-
129
-
130
-
131
-
132
-
133
-
134
-
135
-
136
-
137
-
138
-
139
-
140
-
141
-
142
-
143
-
144
-
145
-
146
-
147
-
148
-
149
-
150
-
151
-
152
-
153
-
154
-
155
-
156
-
157
-
158
-
159
 |
 |

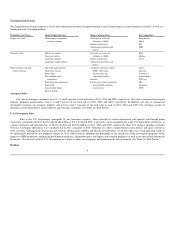
Our total backlog at December 31, 2011 and 2010 was $16,160 and $14,616 million, respectively. We anticipate that approximately $12,018 million of
the 2011 backlog will be filled in 2012. We believe that backlog is not necessarily a reliable indicator of our future sales because a substantial portion of the
orders constituting this backlog may be canceled at the customer's option.
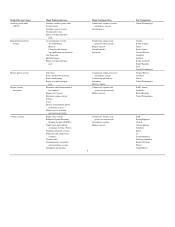
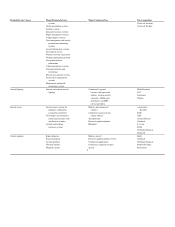
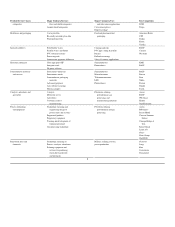
Competition
We are subject to active competition in substantially all product and service areas. Competition is expected to continue in all geographic regions.
Competitive conditions vary widely among the thousands of products and services provided by us, and vary by country. Our businesses compete on a variety
of factors, such as price, quality, reliability, delivery, customer service, performance, applied technology, product innovation and product recognition. Brand
identity, service to customers and quality are important competitive factors for our products and services, and there is considerable price competition. Other
competitive factors include breadth of product line, research and development efforts and technical and managerial capability. While our competitive position
varies among our products and services, we believe we are a significant competitor in each of our major product and service classes. A number of our
products and services are sold in competition with those of a large number of other companies, some of which have substantial financial resources and
significant technological capabilities. In addition, some of our products compete with the captive component divisions of original equipment manufacturers.
See Item 1A "Risk Factors" for further discussion.
International Operations
We are engaged in manufacturing, sales, service and research and development globally. U.S. exports and foreign manufactured products are significant
to our operations. U.S. exports comprised 12, 11 and 12 percent of our total sales in 2011, 2010 and 2009, respectively. Foreign manufactured products and
services, mainly in Europe and Asia, were 43, 42 and 40 percent of our total sales in 2011, 2010 and 2009, respectively.
Approximately 18 percent of total 2011 sales of Aerospace-related products and services were exports of U.S. manufactured products and systems and
performance of services such as aircraft repair and overhaul. Exports were principally made to Europe, Asia, Canada, and Latin America. Foreign
manufactured products and systems and performance of services comprised approximately 15 percent of total 2011 Aerospace sales. The principal
manufacturing facilities outside the U.S. are in Europe, with less significant operations in Canada and Asia.
Approximately 3 percent of total 2011 sales of Automation and Control Solutions products and services were exports of U.S. manufactured products.
Foreign manufactured products and performance of services accounted for 58 percent of total 2011 Automation and Control Solutions sales. The principal
manufacturing facilities outside the U.S. are in Europe and Asia, with less significant operations in Canada and Australia.
Approximately 34 percent of total 2011 sales of Performance Materials and Technologies products and services were exports of U.S. manufactured
products. Exports were principally made to Asia and Latin America. Foreign manufactured products and performance of services comprised 25 percent of
total 2011 Performance Materials and Technologies sales. The principal manufacturing facilities outside the U.S. are in Europe, with less significant
operations in Asia.
Approximately 3 percent of total 2011 sales of Transportation Systems products were exports of U.S. manufactured products. Foreign manufactured
products accounted for 85 percent of total 2011 sales of Transportation Systems. The principal manufacturing facilities outside the U.S. are in Europe, with
less significant operations in Asia and Latin America.
Financial information including net sales and long-lived assets related to geographic areas is included in Note 24 of Notes to Financial Statements in
"Item 8. Financial Statements and Supplementary Data". Information regarding the economic, political, regulatory and other risks associated with
international operations is included in "Item 1A. Risk Factors."
Raw Materials
The principal raw materials used in our operations are generally readily available. Although we occasionally experience disruption in raw materials
supply, we experienced no significant problems in the purchase of key raw materials and commodities in 2011. We are not dependent on any one supplier for
a material
10