Honeywell 2011 Annual Report Download - page 108
Download and view the complete annual report
Please find page 108 of the 2011 Honeywell annual report below. You can navigate through the pages in the report by either clicking on the pages listed below, or by using the keyword search tool below to find specific information within the annual report.-
 1
1 -
2
-
3
-
4
-
5
-
6
-
7
-
8
-
9
-
10
-
11
-
12
-
13
-
14
-
15
-
16
-
17
-
18
-
19
-
20
-
21
-
22
-
23
-
24
-
25
-
26
-
27
-
28
-
29
-
30
-
31
-
32
-
33
-
34
-
35
-
36
-
37
-
38
-
39
-
40
-
41
-
42
-
43
-
44
-
45
-
46
-
47
-
48
-
49
-
50
-
51
-
52
-
53
-
54
-
55
-
56
-
57
-
58
-
59
-
60
-
61
-
62
-
63
-
64
-
65
-
66
-
67
-
68
-
69
-
70
-
71
-
72
-
73
-
74
-
75
-
76
-
77
-
78
-
79
-
80
-
81
-
82
-
83
-
84
-
85
-
86
-
87
-
88
-
89
-
90
-
91
-
92
-
93
-
94
-
95
-
96
-
97
-
 98
98 -
 99
99 -
 100
100 -
 101
101 -
 102
102 -
 103
103 -
 104
104 -
 105
105 -
 106
106 -
 107
107 -
 108
108 -
 109
109 -
 110
110 -
 111
111 -
 112
112 -
 113
113 -
 114
114 -
 115
115 -
 116
116 -
 117
117 -
 118
118 -
119
-
120
-
121
-
122
-
123
-
124
-
125
-
126
-
127
-
128
-
129
-
130
-
131
-
132
-
133
-
134
-
135
-
136
-
137
-
138
-
139
-
140
-
141
-
142
-
143
-
144
-
145
-
146
-
147
-
148
-
149
-
150
-
151
-
152
-
153
-
154
-
155
-
156
-
157
-
158
-
159
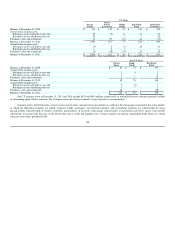
 |
 |

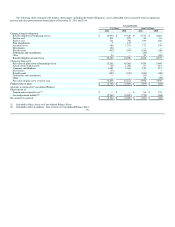
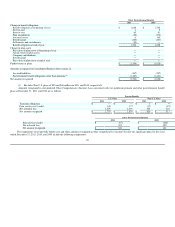
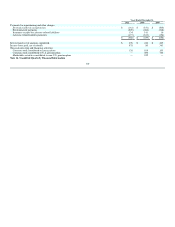
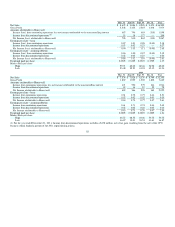
U.S. Plans
Private
Funds
Direct
Private
Investments Hedge
Funds Real Estate
Funds Real Estate
Properties
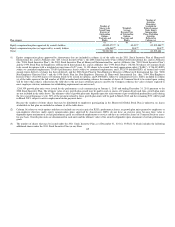
Balance at December 31, 2009 $ 911 $ 149 $ 78 $ 132 $ 452
Actual return on plan assets:
Relating to assets still held at year-end 42 (9) 11 36 45
Relating to assets sold during the year 29 — 1 1 10
Purchases, sales and settlements 71 27 (13) 45 (13)
Balance at December 31, 2010 1,053 167 77 214 494
Actual return on plan assets:
Relating to assets still held at year-end (9) 4 (7) 26 41
Relating to assets sold during the year — 8 4 — —
Purchases, sales and settlements (5) (18) (14) 16 18
Balance at December 31, 2011 $ 1,039 $ 161 $ 60 $ 256 $ 553
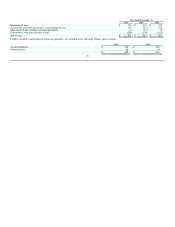
Non-U.S. Plans
Private
Funds Hedge
Funds Real Estate
Funds
Balance at December 31, 2009 $ 81 $ 51 $ 137
Actual return on plan assets:
Relating to assets still held at year-end 2 4 2
Relating to assets sold during the year 3 — 5
Purchases, sales and settlements 3 — 25
Balance at December 31, 2010 89 55 169
Actual return on plan assets:
Relating to assets still held at year-end 2 (1) 7
Relating to assets sold during the year 3 — 2
Purchases, sales and settlements 18 — (18)
Balance at December 31, 2011 $ 112 $ 54 $ 160
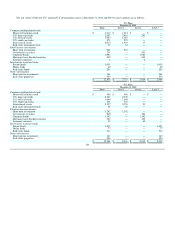
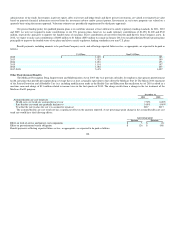
Our U.S. pension assets at December 31, 2011 and 2010 include $976 and $834 million, respectively, in notional derivative exposure primarily related
to outstanding equity futures contracts. The Company enters into futures contracts to gain exposure to certain markets.
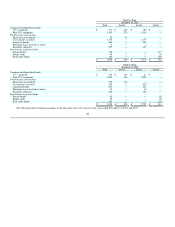
Common stocks, preferred stocks, real estate investment trusts, and short-term investments are valued at the closing price reported in the active market
in which the individual securities are traded. Corporate bonds, mortgages, asset-backed securities, and government securities are valued either by using
pricing models, bids provided by brokers or dealers, quoted prices of securities with similar characteristics or discounted cash flows and as such include
adjustments for certain risks that may not be observable such as credit and liquidity risks. Certain securities are held in commingled funds which are valued
using net asset values provided by the
105