Honeywell 2011 Annual Report Download - page 36
Download and view the complete annual report
Please find page 36 of the 2011 Honeywell annual report below. You can navigate through the pages in the report by either clicking on the pages listed below, or by using the keyword search tool below to find specific information within the annual report.-
 1
1 -
2
-
3
-
4
-
5
-
6
-
7
-
8
-
9
-
10
-
11
-
12
-
13
-
14
-
15
-
16
-
17
-
18
-
19
-
20
-
21
-
22
-
23
-
24
-
25
-
 26
26 -
 27
27 -
 28
28 -
 29
29 -
 30
30 -
 31
31 -
 32
32 -
 33
33 -
 34
34 -
 35
35 -
 36
36 -
 37
37 -
 38
38 -
 39
39 -
 40
40 -
 41
41 -
 42
42 -
 43
43 -
 44
44 -
 45
45 -
 46
46 -
47
-
48
-
49
-
50
-
51
-
52
-
53
-
54
-
55
-
56
-
57
-
58
-
59
-
60
-
61
-
62
-
63
-
64
-
65
-
66
-
67
-
68
-
69
-
70
-
71
-
72
-
73
-
74
-
75
-
76
-
77
-
78
-
79
-
80
-
81
-
82
-
83
-
84
-
85
-
86
-
87
-
88
-
89
-
90
-
91
-
92
-
93
-
94
-
95
-
96
-
97
-
98
-
99
-
100
-
101
-
102
-
103
-
104
-
105
-
106
-
107
-
108
-
109
-
110
-
111
-
112
-
113
-
114
-
115
-
116
-
117
-
118
-
119
-
120
-
121
-
122
-
123
-
124
-
125
-
126
-
127
-
128
-
129
-
130
-
131
-
132
-
133
-
134
-
135
-
136
-
137
-
138
-
139
-
140
-
141
-
142
-
143
-
144
-
145
-
146
-
147
-
148
-
149
-
150
-
151
-
152
-
153
-
154
-
155
-
156
-
157
-
158
-
159
 |
 |

•New aircraft production rates and delivery schedules set by commercial air transport, regional jet, business and general aviation OE
manufacturers, as well as airline profitability, platform mix and retirement of aircraft from service;
•Global demand for commercial air travel as reflected in global flying hours and utilization rates for corporate and general aviation aircraft, as
well as the demand for spare parts and maintenance and repair services for aircraft currently in use;
• Level and mix of U.S. Government appropriations for defense and space programs and military activity;
• Changes in customer platform development schedules, requirements and demands for new technologies; and
• Availability and price volatility of raw materials such as titanium and other metals.
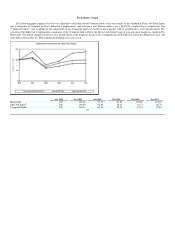
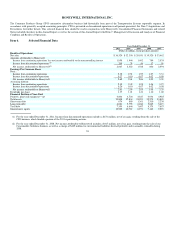
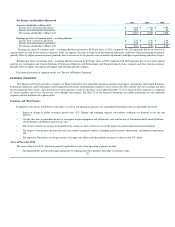
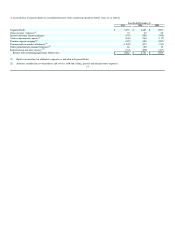
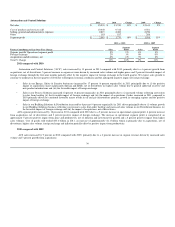
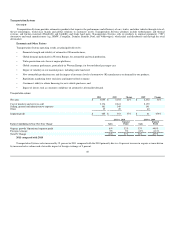
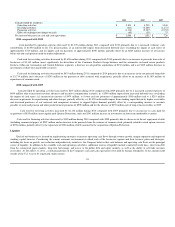
Aerospace
2011 2010 Change 2009 Change
Net sales $ 11,475 $ 10,683 7% $ 10,763 (1)%
Cost of products and services sold 8,665 8,099 8,099
Selling, general and administrative expenses 591 553 570
Other 196 196 201
Segment profit $ 2,023 $ 1,835 10% $ 1,893 (3)%
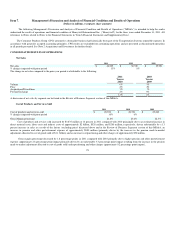
2011 vs. 2010 2010 vs. 2009
Factors Contributing to Year-Over-Year Change Sales Segment
Profit Sales Segment
Profit
Organic growth/ Operational segment profit 7% 9% 0% 0%
Acquisitions and divestitures, net 0% 0% 0% 0%
Other 0% 1% (1)% (3)%
Total % Change 7% 10% (1)% (3)%
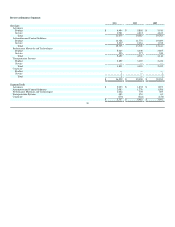
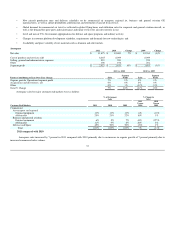
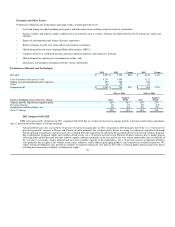
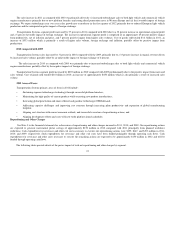
Aerospace sales by major customer end-markets were as follows:
% of Aerospace
Sales % Change in
Sales
Customer End-Markets 2011 2010 2009
2011
Versus
2010
2010
Versus
2009
Commercial:
Air transport and regional
Original equipment 13% 13% 13% 6% (2)%
Aftermarket 25% 23% 22% 16% 1%
Business and general aviation
Original equipment 6% 5% 7% 41% (27)%
Aftermarket 11% 9% 8% 24% 8%
Defense and Space 45% 50% 50% (2)% 1%
Total 100% 100% 100% 7% (1)%
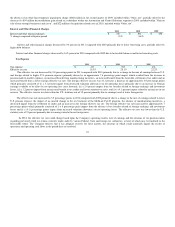
2011 compared with 2010
Aerospace sales increased by 7 percent in 2011 compared with 2010 primarily due to an increase in organic growth of 7 percent primarily due to
increased commercial sales volume.
33