Honeywell 2011 Annual Report Download - page 44
Download and view the complete annual report
Please find page 44 of the 2011 Honeywell annual report below. You can navigate through the pages in the report by either clicking on the pages listed below, or by using the keyword search tool below to find specific information within the annual report.-
 1
1 -
2
-
3
-
4
-
5
-
6
-
7
-
8
-
9
-
10
-
11
-
12
-
13
-
14
-
15
-
16
-
17
-
18
-
19
-
20
-
21
-
22
-
23
-
24
-
25
-
26
-
27
-
28
-
29
-
30
-
31
-
32
-
33
-
 34
34 -
 35
35 -
 36
36 -
 37
37 -
 38
38 -
 39
39 -
 40
40 -
 41
41 -
 42
42 -
 43
43 -
 44
44 -
 45
45 -
 46
46 -
 47
47 -
 48
48 -
 49
49 -
 50
50 -
 51
51 -
 52
52 -
 53
53 -
 54
54 -
55
-
56
-
57
-
58
-
59
-
60
-
61
-
62
-
63
-
64
-
65
-
66
-
67
-
68
-
69
-
70
-
71
-
72
-
73
-
74
-
75
-
76
-
77
-
78
-
79
-
80
-
81
-
82
-
83
-
84
-
85
-
86
-
87
-
88
-
89
-
90
-
91
-
92
-
93
-
94
-
95
-
96
-
97
-
98
-
99
-
100
-
101
-
102
-
103
-
104
-
105
-
106
-
107
-
108
-
109
-
110
-
111
-
112
-
113
-
114
-
115
-
116
-
117
-
118
-
119
-
120
-
121
-
122
-
123
-
124
-
125
-
126
-
127
-
128
-
129
-
130
-
131
-
132
-
133
-
134
-
135
-
136
-
137
-
138
-
139
-
140
-
141
-
142
-
143
-
144
-
145
-
146
-
147
-
148
-
149
-
150
-
151
-
152
-
153
-
154
-
155
-
156
-
157
-
158
-
159
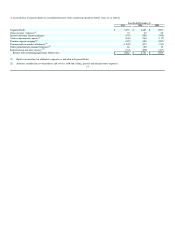
 |
 |

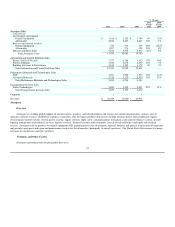
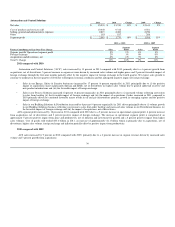
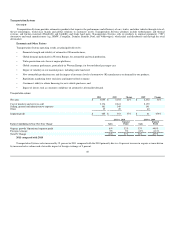
The sales increase in 2011 as compared with 2010 was primarily driven by (i) increased turbocharger sales to both light vehicle and commercial vehicle
engine manufacturers primarily due to new platform launches and strong diesel penetration rates in Western Europe and (ii) the favorable impact of foreign
exchange. We expect turbocharger year over year sales growth rate to moderate in the first quarter of 2012 primarily due to reduced European light vehicle
production and the anticipated negative impact of foreign exchange.
Transportation Systems segment profit increased by 37 percent in 2011 compared with 2010 due to a 32 percent increase in operational segment profit
and a 5 percent favorable impact of foreign exchange. The increase in operational segment profit is comprised of an approximate 25 percent positive impact
from productivity, net of inflation and price, and 7 percent positive impact from higher sales volumes. Cost of goods sold totaled $3.2 billion in 2011, an
increase of $533 million which is primarily a result of higher sales volume, foreign exchange and inflation, partially offset by positive impact from
productivity.
2010 compared with 2009
Transportation Systems sales increased by 31 percent in 2010 compared with the 2009, primarily due to a 33 percent increase in organic revenue driven
by increased sales volume, partially offset by an unfavorable impact of foreign exchange of 2 percent.
The sales increase in 2010 as compared with 2009 was primarily due to increased turbocharger sales to both light vehicle and commercial vehicle
engine manufacturers partially offset by the negative impacts of foreign exchange.
Transportation Systems segment profit increased by $292 million in 2010 compared with 2009 predominantly due to the positive impact from increased
sales volume. Cost of goods sold totaled $2.6 billion in 2010, an increase of approximately $450 million which is also primarily a result of increased sales
volume.
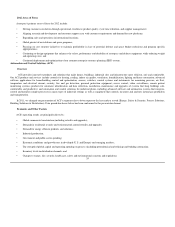
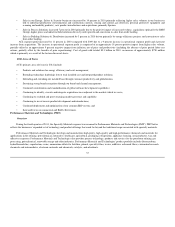
2012 Areas of Focus
Transportation Systems primary areas of focus in 2012 include:
• Sustaining superior turbocharger technology through successful platform launches;
• Maintaining the high quality of current products while executing new product introductions;
• Increasing global penetration and share of diesel and gasoline turbocharger OEM demand;
•Addressing capacity challenges and improving cost structure through increasing plant productivity and expansion of global manufacturing
footprint;
• Aligning cost structure with current economic outlook, and successful execution of repositioning actions; and
• Aligning development efforts and costs with new turbo platform launch schedules.
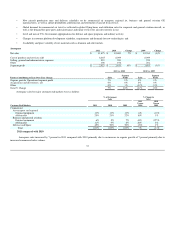
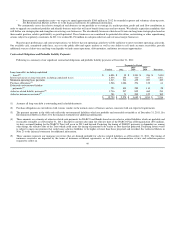
Repositioning and Other Charges
See Note 3 to the financial statements for a discussion of repositioning and other charges incurred in 2011, 2010, and 2009. Our repositioning actions
are expected to generate incremental pretax savings of approximately $150 million in 2012 compared with 2011 principally from planned workforce
reductions. Cash expenditures for severance and other exit costs necessary to execute our repositioning actions were $159, $147, and $193 million in 2011,
2010, and 2009, respectively. Such expenditures for severance and other exit costs have been funded principally through operating cash flows. Cash
expenditures for severance and other costs necessary to execute the remaining actions are expected to be approximately $150 million in 2012 and will be
funded through operating cash flows.
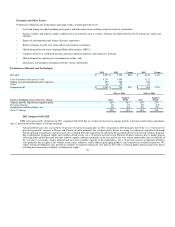
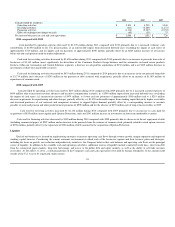
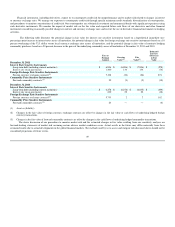
The following tables provide details of the pretax impact of total net repositioning and other charges by segment.
41