Honeywell 2011 Annual Report Download - page 43
Download and view the complete annual report
Please find page 43 of the 2011 Honeywell annual report below. You can navigate through the pages in the report by either clicking on the pages listed below, or by using the keyword search tool below to find specific information within the annual report.-
 1
1 -
2
-
3
-
4
-
5
-
6
-
7
-
8
-
9
-
10
-
11
-
12
-
13
-
14
-
15
-
16
-
17
-
18
-
19
-
20
-
21
-
22
-
23
-
24
-
25
-
26
-
27
-
28
-
29
-
30
-
31
-
32
-
 33
33 -
 34
34 -
 35
35 -
 36
36 -
 37
37 -
 38
38 -
 39
39 -
 40
40 -
 41
41 -
 42
42 -
 43
43 -
 44
44 -
 45
45 -
 46
46 -
 47
47 -
 48
48 -
 49
49 -
 50
50 -
 51
51 -
 52
52 -
 53
53 -
54
-
55
-
56
-
57
-
58
-
59
-
60
-
61
-
62
-
63
-
64
-
65
-
66
-
67
-
68
-
69
-
70
-
71
-
72
-
73
-
74
-
75
-
76
-
77
-
78
-
79
-
80
-
81
-
82
-
83
-
84
-
85
-
86
-
87
-
88
-
89
-
90
-
91
-
92
-
93
-
94
-
95
-
96
-
97
-
98
-
99
-
100
-
101
-
102
-
103
-
104
-
105
-
106
-
107
-
108
-
109
-
110
-
111
-
112
-
113
-
114
-
115
-
116
-
117
-
118
-
119
-
120
-
121
-
122
-
123
-
124
-
125
-
126
-
127
-
128
-
129
-
130
-
131
-
132
-
133
-
134
-
135
-
136
-
137
-
138
-
139
-
140
-
141
-
142
-
143
-
144
-
145
-
146
-
147
-
148
-
149
-
150
-
151
-
152
-
153
-
154
-
155
-
156
-
157
-
158
-
159
 |
 |

Transportation Systems
Overview
Transportation Systems provides automotive products that improve the performance and efficiency of cars, trucks, and other vehicles through state-of-
the-art technologies, world class brands and global solutions to customers' needs. Transportation Systems' products include turbochargers and thermal
systems; and friction materials (Bendix(R) and Jurid(R)) and brake hard parts. Transportation Systems sells its products to original equipment ("OE")
automotive and truck manufacturers (e.g., BMW, Caterpillar, Daimler, Renault, Ford, and Volkswagen), wholesalers and distributors and through the retail
aftermarket.
Economic and Other Factors
Transportation Systems operating results are principally driven by:
• Financial strength and stability of automotive OE manufacturers;
• Global demand, particularly in Western Europe, for automobile and truck production;
• Turbo penetration rates for new engine platforms;
• Global consumer preferences, particularly in Western Europe, for boosted diesel passenger cars;
• Degree of volatility in raw material prices, including nickel and steel;
• New automobile production rates and the impact of inventory levels of automotive OE manufacturers on demand for our products;
• Regulations mandating lower emissions and improved fuel economy;
• Consumers' ability to obtain financing for new vehicle purchases; and
• Impact of factors such as consumer confidence on automotive aftermarket demand.
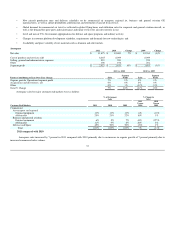
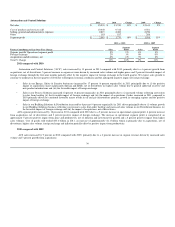
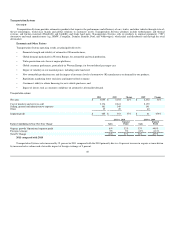
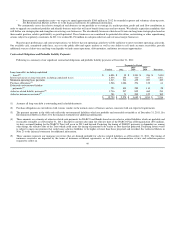
Transportation systems
2011 2010 Change 2009 Change
Net sales $ 3,859 $ 3,192 21% $ 2,432 31%
Cost of products and services sold 3,174 2,641 2,190
Selling, general and administrative expenses 161 149 141
Other 39 49 40
Segment profit $ 485 $ 353 37% $ 61 479%
2011 vs. 2010 2010 vs. 2009
Factors Contributing to Year-Over-Year Change Sales Segment
Profit Sales Segment
Profit
Organic growth/ Operational segment profit 16% 32% 33% 490%
Foreign exchange 5% 5% (2)% (11)%
Total % Change 21% 37% 31% 479%
2011 compared with 2010
Transportation Systems sales increased by 21 percent in 2011 compared with the 2010 primarily due to a 16 percent increase in organic revenue driven
by increased sales volume and a favorable impact of foreign exchange of 5 percent.
40