Honeywell 2011 Annual Report Download - page 39
Download and view the complete annual report
Please find page 39 of the 2011 Honeywell annual report below. You can navigate through the pages in the report by either clicking on the pages listed below, or by using the keyword search tool below to find specific information within the annual report.-
 1
1 -
2
-
3
-
4
-
5
-
6
-
7
-
8
-
9
-
10
-
11
-
12
-
13
-
14
-
15
-
16
-
17
-
18
-
19
-
20
-
21
-
22
-
23
-
24
-
25
-
26
-
27
-
28
-
 29
29 -
 30
30 -
 31
31 -
 32
32 -
 33
33 -
 34
34 -
 35
35 -
 36
36 -
 37
37 -
 38
38 -
 39
39 -
 40
40 -
 41
41 -
 42
42 -
 43
43 -
 44
44 -
 45
45 -
 46
46 -
 47
47 -
 48
48 -
 49
49 -
50
-
51
-
52
-
53
-
54
-
55
-
56
-
57
-
58
-
59
-
60
-
61
-
62
-
63
-
64
-
65
-
66
-
67
-
68
-
69
-
70
-
71
-
72
-
73
-
74
-
75
-
76
-
77
-
78
-
79
-
80
-
81
-
82
-
83
-
84
-
85
-
86
-
87
-
88
-
89
-
90
-
91
-
92
-
93
-
94
-
95
-
96
-
97
-
98
-
99
-
100
-
101
-
102
-
103
-
104
-
105
-
106
-
107
-
108
-
109
-
110
-
111
-
112
-
113
-
114
-
115
-
116
-
117
-
118
-
119
-
120
-
121
-
122
-
123
-
124
-
125
-
126
-
127
-
128
-
129
-
130
-
131
-
132
-
133
-
134
-
135
-
136
-
137
-
138
-
139
-
140
-
141
-
142
-
143
-
144
-
145
-
146
-
147
-
148
-
149
-
150
-
151
-
152
-
153
-
154
-
155
-
156
-
157
-
158
-
159
 |
 |

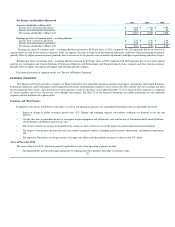
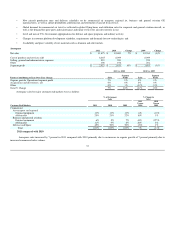
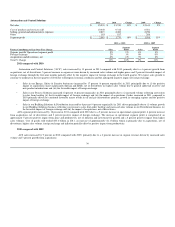
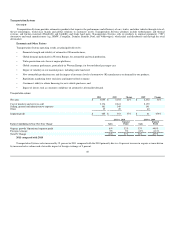
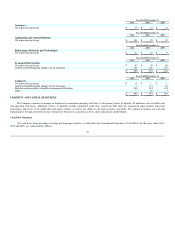
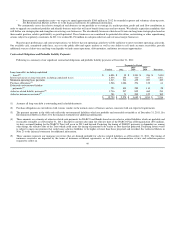
Automation and Control Solutions
2011 2010 Change 2009 Change
Net sales $ 15,535 $ 13,749 13% $ 12,611 9%
Cost of products and services sold 10,448 9,312 8,561
Selling, general and administrative expenses 2,819 2,480 2,256
Other 185 187 206
Segment profit $ 2,083 $ 1,770 18% $ 1,588 11%
2011 vs. 2010 2010 vs. 2009
Factors Contributing to Year-Over-Year Change Sales Segment
Profit Sales Segment
Profit
Organic growth/ Operational segment profit 5% 9% 6% 9%
Foreign exchange 2% 3% 0% 0%
Acquisitions and divestitures, net 6% 6% 3% 2%
Total % Change 13% 18% 9% 11%
2011 compared with 2010
Automation and Control Solutions ("ACS") sales increased by 13 percent in 2011 compared with 2010, primarily due to a 6 percent growth from
acquisitions, net of divestitures, 5 percent increase in organic revenue driven by increased sales volume and higher prices and 2 percent favorable impact of
foreign exchange through the first nine months partially offset by the negative impact of foreign exchange in the fourth quarter. We expect sales growth to
continue to moderate in the first quarter of 2012 due to European economic conditions and the anticipated negative impact of foreign exchange.
•Sales in our Energy, Safety & Security businesses increased by 17 percent (6 percent organically) in 2011 principally due to (i) the positive
impact of acquisitions (most significantly Sperian and EMS), net of divestitures (ii) higher sales volume due to general industrial recovery and
new product introductions and (iii) the favorable impact of foreign exchange.
•Sales in our Process Solutions increased 12 percent (6 percent organically) in 2011 principally due to (i) increased volume reflecting conversion
to sales from backlog (ii) the favorable impact of foreign exchange and (iii) the impact of acquisitions. Orders increased in 2011 compared to
2010 primarily driven by continued favorable macro trends in oil and gas infrastructure projects, growth in emerging regions and the positive
impact of foreign exchange.
•Sales in our Building Solutions & Distribution increased by 6 percent (4 percent organically) in 2011 driven principally due to (i) volume growth
in our Building Solutions business reflecting conversion to sales from order backlog and increased sales volume in our Distribution business (ii)
the favorable impact of foreign exchange and (iii) the impact of acquisitions, net of divestitures.
ACS segment profit increased by 18 percent in 2011 compared with 2010 due to a 9 percent increase in operational segment profit, 6 percent increase
from acquisitions, net of divestitures and 3 percent positive impact of foreign exchange. The increase in operational segment profit is comprised of an
approximate 5 percent positive impact from price and productivity, net of inflation and investment for growth and a 4 percent positive impact from higher
sales volumes. Cost of goods sold totaled $10.4 billion in 2011, an increase of approximately $1.1 billion which is primarily due to acquisitions, net of
divestitures, higher sales volume, foreign exchange and inflation partially offset by positive impact from productivity.
2010 compared with 2009
ACS sales increased by 9 percent in 2010 compared with 2009, primarily due to a 6 percent increase in organic revenue driven by increased sales
volume and 3 percent growth from acquisitions.
36