Honeywell 2011 Annual Report Download - page 49
Download and view the complete annual report
Please find page 49 of the 2011 Honeywell annual report below. You can navigate through the pages in the report by either clicking on the pages listed below, or by using the keyword search tool below to find specific information within the annual report.-
 1
1 -
2
-
3
-
4
-
5
-
6
-
7
-
8
-
9
-
10
-
11
-
12
-
13
-
14
-
15
-
16
-
17
-
18
-
19
-
20
-
21
-
22
-
23
-
24
-
25
-
26
-
27
-
28
-
29
-
30
-
31
-
32
-
33
-
34
-
35
-
36
-
37
-
38
-
 39
39 -
 40
40 -
 41
41 -
 42
42 -
 43
43 -
 44
44 -
 45
45 -
 46
46 -
 47
47 -
 48
48 -
 49
49 -
 50
50 -
 51
51 -
 52
52 -
 53
53 -
 54
54 -
 55
55 -
 56
56 -
 57
57 -
 58
58 -
 59
59 -
60
-
61
-
62
-
63
-
64
-
65
-
66
-
67
-
68
-
69
-
70
-
71
-
72
-
73
-
74
-
75
-
76
-
77
-
78
-
79
-
80
-
81
-
82
-
83
-
84
-
85
-
86
-
87
-
88
-
89
-
90
-
91
-
92
-
93
-
94
-
95
-
96
-
97
-
98
-
99
-
100
-
101
-
102
-
103
-
104
-
105
-
106
-
107
-
108
-
109
-
110
-
111
-
112
-
113
-
114
-
115
-
116
-
117
-
118
-
119
-
120
-
121
-
122
-
123
-
124
-
125
-
126
-
127
-
128
-
129
-
130
-
131
-
132
-
133
-
134
-
135
-
136
-
137
-
138
-
139
-
140
-
141
-
142
-
143
-
144
-
145
-
146
-
147
-
148
-
149
-
150
-
151
-
152
-
153
-
154
-
155
-
156
-
157
-
158
-
159
 |
 |

•Environmental remediation costs—we expect to spend approximately $300 million in 2012 for remedial response and voluntary clean-up costs.
See Environmental Matters in Note 21 to the financial statements for additional information.
We continuously assess the relative strength of each business in our portfolio as to strategic fit, market position, profit and cash flow contribution in
order to upgrade our combined portfolio and identify business units that will most benefit from increased investment. We identify acquisition candidates that
will further our strategic plan and strengthen our existing core businesses. We also identify businesses that do not fit into our long-term strategic plan based on
their market position, relative profitability or growth potential. These businesses are considered for potential divestiture, restructuring or other repositioning
actions subject to regulatory constraints. In 2011 we realized $1,156 million in cash proceeds from sales of non-strategic businesses.
Based on past performance and current expectations, we believe that our operating cash flows will be sufficient to meet our future operating cash needs.
Our available cash, committed credit lines, access to the public debt and equity markets as well as our ability to sell trade accounts receivables, provide
additional sources of short-term and long-term liquidity to fund current operations, debt maturities, and future investment opportunities.
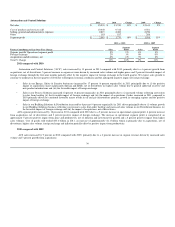
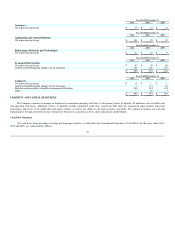
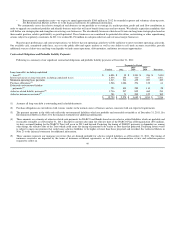
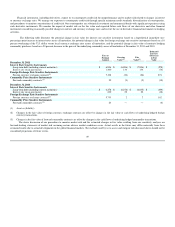
Contractual Obligations and Probable Liability Payments
Following is a summary of our significant contractual obligations and probable liability payments at December 31, 2011:
Payments by Period
Total(6) 2012 2013-
2014 2015-
2016 Thereafter
Long-term debt, including capitalized
leases(1) $ 6,896 $ 15 $ 1,241 $ 456 $ 5,184
Interest payments on long-term debt, including capitalized leases 2,836 258 420 357 1,801
Minimum operating lease payments 1,213 311 432 227 243
Purchase obligations(2) 1,566 1,086 294 122 64
Estimated environmental liability
payments(3) 723 300 285 110 28
Asbestos related liability payments(4) 1,736 237 805 460 234
Asbestos insurance recoveries(5) 780 71 205 122 382
$ 15,750 $ 2,278 $ 3,682 $ 1,854 $ 7,936
(1) Assumes all long-term debt is outstanding until scheduled maturity.
(2) Purchase obligations are entered into with various vendors in the normal course of business and are consistent with our expected requirements.
(3) The payment amounts in the table only reflect the environmental liabilities which are probable and reasonably estimable as of December 31, 2011. See
Environmental Matters in Note 21 to the financial statements for additional information.
(4) These amounts are estimates of asbestos related cash payments for NARCO and Bendix based on our asbestos related liabilities which are probable and
reasonably estimable as of December 31, 2011. Except for amounts due upon the effective date of the NARCO Plan of Reorganization ($76 million),
we have assumed funding for the NARCO Trust will occur in 2013 and beyond. Projecting the timing of NARCO payments is dependent on, among
other things, the effective date of the Trust which could cause the timing of payments to be earlier or later than that projected. Projecting future events
is subject to many uncertainties that could cause asbestos liabilities to be higher or lower than those projected and recorded. See Asbestos Matters in
Note 21 to the financial statements for additional information.
(5) These amounts represent our insurance recoveries that are deemed probable for asbestos related liabilities as of December 31, 2011. The timing of
insurance recoveries are impacted by the terms of insurance settlement agreements, as well as the documentation, review and collection process
required to collect on 46