Honeywell 2011 Annual Report Download - page 69
Download and view the complete annual report
Please find page 69 of the 2011 Honeywell annual report below. You can navigate through the pages in the report by either clicking on the pages listed below, or by using the keyword search tool below to find specific information within the annual report.-
 1
1 -
2
-
3
-
4
-
5
-
6
-
7
-
8
-
9
-
10
-
11
-
12
-
13
-
14
-
15
-
16
-
17
-
18
-
19
-
20
-
21
-
22
-
23
-
24
-
25
-
26
-
27
-
28
-
29
-
30
-
31
-
32
-
33
-
34
-
35
-
36
-
37
-
38
-
39
-
40
-
41
-
42
-
43
-
44
-
45
-
46
-
47
-
48
-
49
-
50
-
51
-
52
-
53
-
54
-
55
-
56
-
57
-
58
-
 59
59 -
 60
60 -
 61
61 -
 62
62 -
 63
63 -
 64
64 -
 65
65 -
 66
66 -
 67
67 -
 68
68 -
 69
69 -
 70
70 -
 71
71 -
 72
72 -
 73
73 -
 74
74 -
 75
75 -
 76
76 -
 77
77 -
 78
78 -
 79
79 -
80
-
81
-
82
-
83
-
84
-
85
-
86
-
87
-
88
-
89
-
90
-
91
-
92
-
93
-
94
-
95
-
96
-
97
-
98
-
99
-
100
-
101
-
102
-
103
-
104
-
105
-
106
-
107
-
108
-
109
-
110
-
111
-
112
-
113
-
114
-
115
-
116
-
117
-
118
-
119
-
120
-
121
-
122
-
123
-
124
-
125
-
126
-
127
-
128
-
129
-
130
-
131
-
132
-
133
-
134
-
135
-
136
-
137
-
138
-
139
-
140
-
141
-
142
-
143
-
144
-
145
-
146
-
147
-
148
-
149
-
150
-
151
-
152
-
153
-
154
-
155
-
156
-
157
-
158
-
159
 |
 |

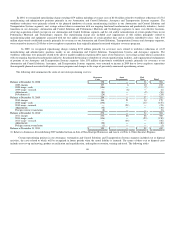
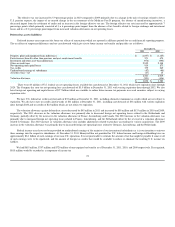
amortized over their estimated lives which range from 1 to 15 years using straight-line and accelerated amortization methods. The excess of the purchase price
over the estimated fair values of net assets acquired (approximating $225 million), was recorded as goodwill. This goodwill is non-deductible for tax
purposes. The results from the acquisition date through December 31, 2009 are included in the Automation and Control Solutions segment and were not
material to the consolidated financial statements.
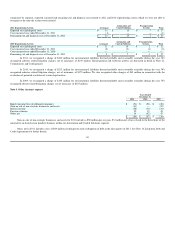
In connection with all acquisitions in 2011, 2010 and 2009, the amounts recorded for transaction costs and the costs of integrating the acquired
businesses into Honeywell were not material.
The pro forma results for 2011, 2010 and 2009, assuming these acquisitions had been made at the beginning of the comparable prior year, would not be
materially different from consolidated reported results.
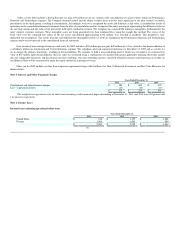
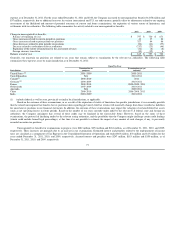
Divestitures–In July 2011, the Company sold its Consumer Products Group business (CPG) to Rank Group Limited. The sale was completed for
approximately $955 million in cash proceeds, resulting in a pre-tax gain of approximately $301 million and approximately $178 million net of tax. The gain
was recorded in net income from discontinued operations after taxes in the Company's Consolidated Statement of Operations for the year ended December 31,
2011. The net income attributable to the non-controlling interest for the discontinued operations is insignificant. The sale of CPG, which had been part of the
Transportation Systems segment, is consistent with the Company's strategic focus on its portfolio of differentiated global technologies.
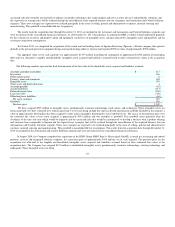
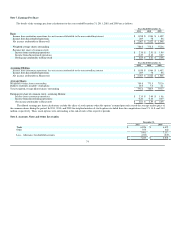
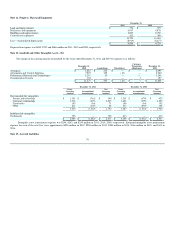
The key components of income from discontinued operations related to CPG were as follows:
Year Ended
December 31,
2011 2010 2009
Net sales $ 530 $ 1,020 $ 957
Costs, expenses and other 421 798 752
Selling, general and administrative expense 63 99 120
Other (income) expense (2) 2 —
(Loss) income before taxes 48 121 85
Gain on disposal of discontinued operations 301 — —
Net income from discontinued operations before taxes 349 121 85
Tax expense 140 43 29
Net income from discontinued operations after taxes $ 209 $ 78 $ 56
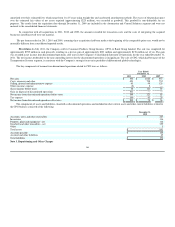
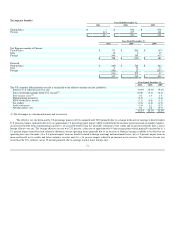
The components of assets and liabilities classified as discontinued operations and included in other current assets and other current liabilities related to
the CPG business consisted of the following:
December 31,
2010
Accounts, notes and other receivables $ 227
Inventories 136
Property, plant and equipment - net 116
Goodwill and other intangibles - net 359
Other 3
Total assets $ 841
Accounts payable $ 145
Accrued and other liabilities 45
Total liabilities $ 190
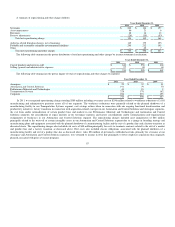
Note 3. Repositioning and Other Charges
66