Honeywell 2011 Annual Report Download - page 79
Download and view the complete annual report
Please find page 79 of the 2011 Honeywell annual report below. You can navigate through the pages in the report by either clicking on the pages listed below, or by using the keyword search tool below to find specific information within the annual report.-
 1
1 -
2
-
3
-
4
-
5
-
6
-
7
-
8
-
9
-
10
-
11
-
12
-
13
-
14
-
15
-
16
-
17
-
18
-
19
-
20
-
21
-
22
-
23
-
24
-
25
-
26
-
27
-
28
-
29
-
30
-
31
-
32
-
33
-
34
-
35
-
36
-
37
-
38
-
39
-
40
-
41
-
42
-
43
-
44
-
45
-
46
-
47
-
48
-
49
-
50
-
51
-
52
-
53
-
54
-
55
-
56
-
57
-
58
-
59
-
60
-
61
-
62
-
63
-
64
-
65
-
66
-
67
-
68
-
 69
69 -
 70
70 -
 71
71 -
 72
72 -
 73
73 -
 74
74 -
 75
75 -
 76
76 -
 77
77 -
 78
78 -
 79
79 -
 80
80 -
 81
81 -
 82
82 -
 83
83 -
 84
84 -
 85
85 -
 86
86 -
 87
87 -
 88
88 -
 89
89 -
90
-
91
-
92
-
93
-
94
-
95
-
96
-
97
-
98
-
99
-
100
-
101
-
102
-
103
-
104
-
105
-
106
-
107
-
108
-
109
-
110
-
111
-
112
-
113
-
114
-
115
-
116
-
117
-
118
-
119
-
120
-
121
-
122
-
123
-
124
-
125
-
126
-
127
-
128
-
129
-
130
-
131
-
132
-
133
-
134
-
135
-
136
-
137
-
138
-
139
-
140
-
141
-
142
-
143
-
144
-
145
-
146
-
147
-
148
-
149
-
150
-
151
-
152
-
153
-
154
-
155
-
156
-
157
-
158
-
159
 |
 |
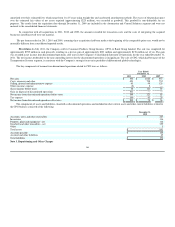
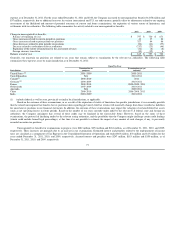
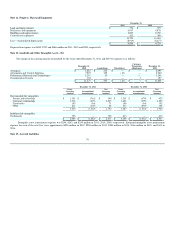
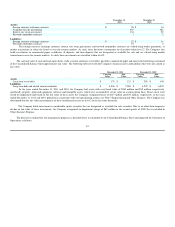
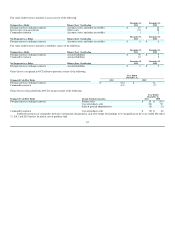
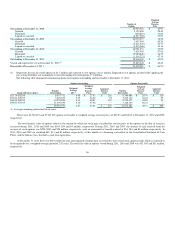
Note 11. Property, Plant and Equipment
December 31,
2011 2010
Land and improvements $ 376 $ 375
Machinery and equipment 9,937 9,878
Buildings and improvements 2,897 2,750
Construction in progress 513 398
13,723 13,401
Less—Accumulated depreciation (8,919) (8,677)
$ 4,804 $ 4,724
Depreciation expense was $699, $707 and $686 million in 2011, 2010 and 2009, respectively.
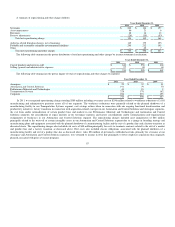
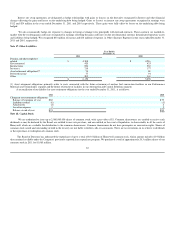
Note 12. Goodwill and Other Intangible Assets - Net
The change in the carrying amount of goodwill for the years ended December 31, 2011 and 2010 by segment is as follows:
December 31,
2010 Acquisitions Divestitures
Currency
Translation
Adjustment December 31,
2011
Aerospace $ 1,883 $ 212 $ — $ — $ 2,095
Automation and Control Solutions 7,907 365 (12) — 8,260
Performance Materials and Technologies 1,291 15 — — 1,306
Transportation Systems 194 — — 3 197
$ 11,275 $ 592 $ (12) $ 3 $ 11,858
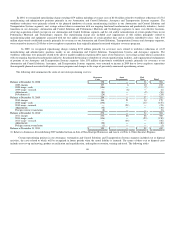
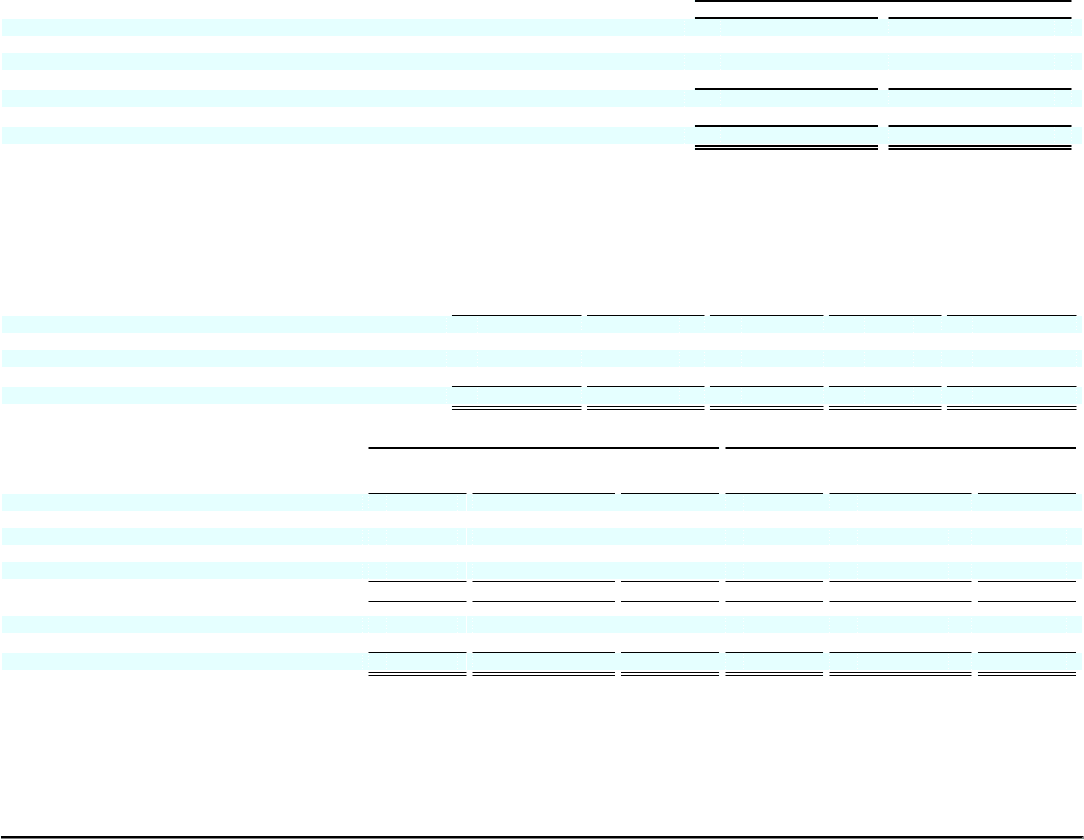
December 31, 2011 December 31, 2010
Gross
Carrying
Amount Accumulated
Amortization
Net
Carrying
Amount
Gross
Carrying
Amount Accumulated
Amortization
Net
Carrying
Amount
Determinable life intangibles:
Patents and technology $ 1,151 $ (761) $ 390 $ 1,101 $ (676) $ 425
Customer relationships 1,718 (493) 1,225 1,688 (399) 1,289
Trademarks 155 (84) 71 186 (84) 102
Other 211 (145) 66 512 (404) 108
3,235 (1,483) 1,752 3,487 (1,563) 1,924
Indefinite life intangibles:
Trademarks 725 — 725 613 — 613
$ 3,960 $ (1,483) $ 2,477 $ 4,100 $ (1,563) $ 2,537
Intangible assets amortization expense was $249, $263, and $250 million in 2011, 2010, 2009, respectively. Estimated intangible asset amortization
expense for each of the next five years approximates $250 million in 2012, $226 million in 2013, $200 million in 2014, $166 million in 2015, and $141 in
2016.
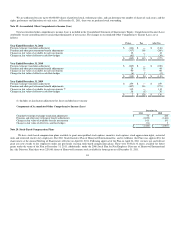
Note 13. Accrued Liabilities
76