Honeywell 2011 Annual Report Download - page 37
Download and view the complete annual report
Please find page 37 of the 2011 Honeywell annual report below. You can navigate through the pages in the report by either clicking on the pages listed below, or by using the keyword search tool below to find specific information within the annual report.-
 1
1 -
2
-
3
-
4
-
5
-
6
-
7
-
8
-
9
-
10
-
11
-
12
-
13
-
14
-
15
-
16
-
17
-
18
-
19
-
20
-
21
-
22
-
23
-
24
-
25
-
26
-
 27
27 -
 28
28 -
 29
29 -
 30
30 -
 31
31 -
 32
32 -
 33
33 -
 34
34 -
 35
35 -
 36
36 -
 37
37 -
 38
38 -
 39
39 -
 40
40 -
 41
41 -
 42
42 -
 43
43 -
 44
44 -
 45
45 -
 46
46 -
 47
47 -
48
-
49
-
50
-
51
-
52
-
53
-
54
-
55
-
56
-
57
-
58
-
59
-
60
-
61
-
62
-
63
-
64
-
65
-
66
-
67
-
68
-
69
-
70
-
71
-
72
-
73
-
74
-
75
-
76
-
77
-
78
-
79
-
80
-
81
-
82
-
83
-
84
-
85
-
86
-
87
-
88
-
89
-
90
-
91
-
92
-
93
-
94
-
95
-
96
-
97
-
98
-
99
-
100
-
101
-
102
-
103
-
104
-
105
-
106
-
107
-
108
-
109
-
110
-
111
-
112
-
113
-
114
-
115
-
116
-
117
-
118
-
119
-
120
-
121
-
122
-
123
-
124
-
125
-
126
-
127
-
128
-
129
-
130
-
131
-
132
-
133
-
134
-
135
-
136
-
137
-
138
-
139
-
140
-
141
-
142
-
143
-
144
-
145
-
146
-
147
-
148
-
149
-
150
-
151
-
152
-
153
-
154
-
155
-
156
-
157
-
158
-
159
 |
 |

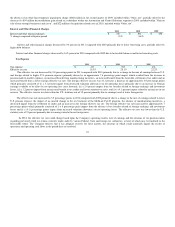
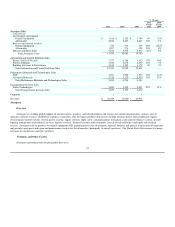
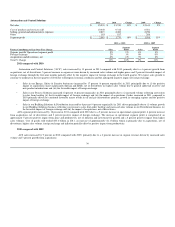
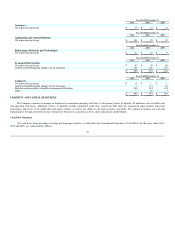
Details regarding the changes in sales by customer end-markets are as follows:
•Air transport and regional original equipment (OE) sales increased by 6 percent in 2011 primarily driven by higher sales to our OE customers,
consistent with higher production rates, platform mix and a higher win rate on selectables (components selected by purchasers of new aircraft).
•Air transport and regional aftermarket sales increased by 16 percent for 2011 primarily due to (i) increased maintenance activity and spare parts
sales driven by an approximately 6 percent increase in global flying hours, (ii) increased sales of avionics upgrades, and (iii) changes in customer
buying patterns relating to spare parts and maintenance activity.
•Business and general aviation OE sales increased by 41 percent in 2011 due to a rebound from near trough levels in 2010 and strong demand in
the business jet end market, favorable platform mix, growth from acquisitions and lower OEM Payments (as defined below) during 2011.
•Business and general aviation aftermarket sales increased by 24 percent in 2011 primarily due to increased sales of spare parts and revenue
associated with maintenance service agreements.
•Defense and space sales decreased by 2 percent in 2011 primarily due to anticipated program ramp downs, partially offset by higher domestic and
international aftermarket sales, increased unmanned aerial vehicle (UAV) shipments and the EMS acquisition (refer to Note 2).
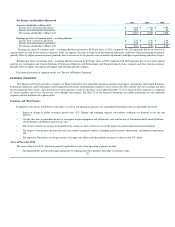
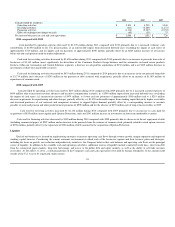
Aerospace segment profit increased by 10 percent in 2011 compared with 2010 primarily due to an increase in operational segment profit of 9 percent
and an increase of 1 percent due to lower OEM Payments made during 2011. The increase in operational segment profit is comprised of the positive impact
from higher commercial aftermarket demand, price and productivity, net of inflation, partially offset by research, development and engineering investments.
Cost of goods sold totaled $8.7 billion in 2011, an increase of approximately $566 million from 2010 which is primarily a result of the factors discussed
above.
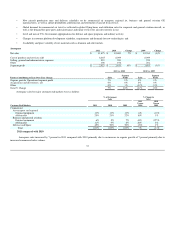
2010 compared with 2009
Aerospace sales decreased by 1 percent in 2010 compared with 2009 primarily due to a 1 percent reduction of revenue related to amounts recognized
for payments to business and general aviation original equipment manufacturers to partially offset their pre-production costs associated with new aircraft
platforms (OEM Payments).
Details regarding the decrease in sales by customer end-markets are as follows:
•Air transport and regional original equipment (OE) sales decreased by 2 percent in 2010 primarily due to lower sales to our air transport OE
customers.
•Air transport and regional aftermarket sales increased by 1 percent in 2010 primarily due to increased sales of spare parts driven by the impact of
increased flying hours of approximately 6 percent in 2010.
•Business and general aviation OE sales decreased by 27 percent in 2010 due to decreases in new business jet deliveries reflecting rescheduling
and cancellations of deliveries by OE customers in the first six months and the impact of the OEM Payments discussed above.
•Business and general aviation aftermarket sales increased by 8 percent in 2010 primarily due to increased sales of spare parts due to higher
engine utilization, partially offset by lower revenue associated with licensing and maintenance service agreements.
•Defense and space sales increased by 1 percent in 2010 primarily due to higher sales of logistics services partially offset by program wind-downs
and completions and lower sales related to commercial helicopters.
Aerospace segment profit decreased by 3 percent in 2010 compared to 2009 primarily due to a negative 3 percent impact from the OEM payments,
discussed above. Operational segment profit was flat in 2010 with the approximate positive 4 percent impact from price and productivity, net of inflation
(including the absence of prior period labor cost actions offset by the benefits from prior repositioning actions) offset by an approximate negative 4 percent
impact from lower sales volume. Cost of goods sold totaled $8.1 billion in 2010, unchanged from 2009.
34