Honeywell 2011 Annual Report Download - page 62
Download and view the complete annual report
Please find page 62 of the 2011 Honeywell annual report below. You can navigate through the pages in the report by either clicking on the pages listed below, or by using the keyword search tool below to find specific information within the annual report.-
 1
1 -
2
-
3
-
4
-
5
-
6
-
7
-
8
-
9
-
10
-
11
-
12
-
13
-
14
-
15
-
16
-
17
-
18
-
19
-
20
-
21
-
22
-
23
-
24
-
25
-
26
-
27
-
28
-
29
-
30
-
31
-
32
-
33
-
34
-
35
-
36
-
37
-
38
-
39
-
40
-
41
-
42
-
43
-
44
-
45
-
46
-
47
-
48
-
49
-
50
-
51
-
 52
52 -
 53
53 -
 54
54 -
 55
55 -
 56
56 -
 57
57 -
 58
58 -
 59
59 -
 60
60 -
 61
61 -
 62
62 -
 63
63 -
 64
64 -
 65
65 -
 66
66 -
 67
67 -
 68
68 -
 69
69 -
 70
70 -
 71
71 -
 72
72 -
73
-
74
-
75
-
76
-
77
-
78
-
79
-
80
-
81
-
82
-
83
-
84
-
85
-
86
-
87
-
88
-
89
-
90
-
91
-
92
-
93
-
94
-
95
-
96
-
97
-
98
-
99
-
100
-
101
-
102
-
103
-
104
-
105
-
106
-
107
-
108
-
109
-
110
-
111
-
112
-
113
-
114
-
115
-
116
-
117
-
118
-
119
-
120
-
121
-
122
-
123
-
124
-
125
-
126
-
127
-
128
-
129
-
130
-
131
-
132
-
133
-
134
-
135
-
136
-
137
-
138
-
139
-
140
-
141
-
142
-
143
-
144
-
145
-
146
-
147
-
148
-
149
-
150
-
151
-
152
-
153
-
154
-
155
-
156
-
157
-
158
-
159
 |
 |

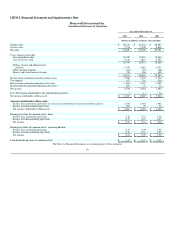
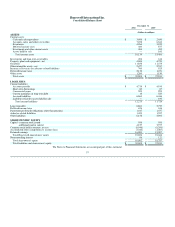
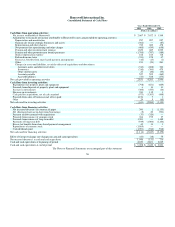
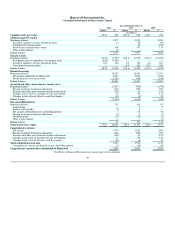
Honeywell International Inc.
Consolidated Statement of Shareowners' Equity
Years Ended December 31,
2011 2010 2009
Shares $ Shares $ Shares $
(in millions)
Common stock, par value 957.6 958 957.6 958 957.6 958
Additional paid-in capital
Beginning balance 3,977 3,823 3,994
Issued for employee savings and option plans 14 (35) (99)
Contributed to pension plans — 32 (190)
Stock-based compensation expense 168 157 118
Other owner changes (2) — —
Ending balance 4,157 3,977 3,823
Treasury stock
Beginning balance (174.6) (8,299) (193.4) (8,995) (223.0) (10,206)
Reacquired stock or repurchases of common stock (20.3) (1,085) — — — —
Issued for employee savings and option plans 12.0 436 8.9 328 6.6 281
Contributed to pension plans — — 9.9 368 23.0 930
Ending balance (182.9) (8,948) (174.6) (8,299) (193.4) (8,995)
Retained earnings
Beginning balance 15,097 14,023 13,391
Net income attributable to Honeywell 2,067 2,022 1,548
Dividends paid on common stock (1,081) (948) (916)
Ending balance 16,083 15,097 14,023
Accumulated other comprehensive income (loss)
Beginning balance (1,067) (948) (1,078)
Foreign exchange translation adjustment (146) (249) 259
Pensions and other post retirement benefit adjustments (209) 44 (271)
Changes in fair value of available for sale investments 12 90 112
Changes in fair value of effective cash flow hedges (34) (4) 30
Ending balance (1,444) (1,067) (948)
Non controlling interest
Beginning balance 121 110 82
Acquisitions — 2 5
Interest sold (bought) (5) 4 —
Net income attributable to non controlling interest 7 13 36
Foreign exchange translation adjustment (4) 2 (1)
Dividends paid (23) (10) (9)
Other owner changes — — (3)
Ending balance 96 121 110
Total shareowners equity 774.7 10,902 783.0 10,787 764.2 8,971
Comprehensive income
Net income 2,074 2,035 1,584
Foreign exchange translation adjustment (146) (249) 259
Pensions and other post retirement benefit adjustments (209) 44 (271)
Changes in fair value of available for sale investments 12 90 112
Changes in fair value of effective cash flow hedges (34) (4) 30
Total comprehensive income 1,697 1,916 1,714
Comprehensive income attributable to non controlling interest (3) (15) (36)
Comprehensive income (loss) attributable to Honeywell 1,694 1,901 1,678
The Notes to Financial Statements are integral part of this statement.
59