Honeywell 2011 Annual Report Download - page 73
Download and view the complete annual report
Please find page 73 of the 2011 Honeywell annual report below. You can navigate through the pages in the report by either clicking on the pages listed below, or by using the keyword search tool below to find specific information within the annual report.-
 1
1 -
2
-
3
-
4
-
5
-
6
-
7
-
8
-
9
-
10
-
11
-
12
-
13
-
14
-
15
-
16
-
17
-
18
-
19
-
20
-
21
-
22
-
23
-
24
-
25
-
26
-
27
-
28
-
29
-
30
-
31
-
32
-
33
-
34
-
35
-
36
-
37
-
38
-
39
-
40
-
41
-
42
-
43
-
44
-
45
-
46
-
47
-
48
-
49
-
50
-
51
-
52
-
53
-
54
-
55
-
56
-
57
-
58
-
59
-
60
-
61
-
62
-
 63
63 -
 64
64 -
 65
65 -
 66
66 -
 67
67 -
 68
68 -
 69
69 -
 70
70 -
 71
71 -
 72
72 -
 73
73 -
 74
74 -
 75
75 -
 76
76 -
 77
77 -
 78
78 -
 79
79 -
 80
80 -
 81
81 -
 82
82 -
 83
83 -
84
-
85
-
86
-
87
-
88
-
89
-
90
-
91
-
92
-
93
-
94
-
95
-
96
-
97
-
98
-
99
-
100
-
101
-
102
-
103
-
104
-
105
-
106
-
107
-
108
-
109
-
110
-
111
-
112
-
113
-
114
-
115
-
116
-
117
-
118
-
119
-
120
-
121
-
122
-
123
-
124
-
125
-
126
-
127
-
128
-
129
-
130
-
131
-
132
-
133
-
134
-
135
-
136
-
137
-
138
-
139
-
140
-
141
-
142
-
143
-
144
-
145
-
146
-
147
-
148
-
149
-
150
-
151
-
152
-
153
-
154
-
155
-
156
-
157
-
158
-
159
 |
 |

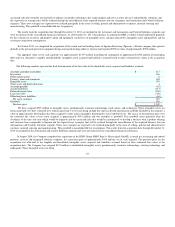
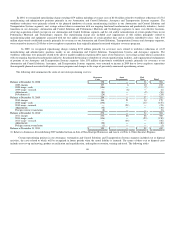
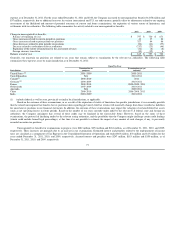
Other, net for 2010 includes a $62 million pre-tax gain, $39 million net of tax, related to the consolidation of a joint venture within our Performance
Materials and Technologies segment. The Company obtained control and the ability to direct those activities most significant to the joint venture's economic
performance in the third quarter, resulting in consolidation. Accordingly, we have i) recognized the assets and liabilities at fair value, ii) included the results of
operations in the consolidated financial statements from the date of consolidation and iii) recognized the above noted gain representing the difference between
the carrying amount and fair value of our previously held equity method investment. The Company has assigned $24 million to intangibles, predominantly the
joint venture's customer contracts. These intangible assets are being amortized over their estimated lives using the straight line method. The excess of the
book value over the estimated fair values of the net assets consolidated approximating $132 million, was recorded as goodwill. This goodwill is non-
deductible for tax purposes. The results from the consolidation date through December 31, 2010 are included in the Performance Materials and Technologies
segment and were not material to the consolidated financial statements.
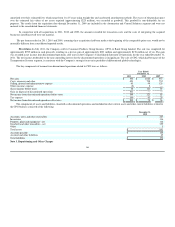
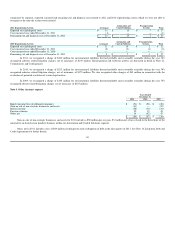
Gain on sale of non-strategic businesses and assets for 2009 includes a $50 million pre-tax gain, $42 million net of tax, related to the deconsolidation of
a subsidiary within our Automation and Control Solutions segment. The subsidiary achieved contractual milestones at December 31, 2009 and as a result, we
are no longer the primary beneficiary, resulting in deconsolidation. We continue to hold a non-controlling interest which was recorded at its estimated fair
value of $67 million upon deconsolidation. The fair value was estimated using a combination of a market and income approaches utilizing observable market
data for comparable businesses and discounted cash flow modeling. Our non-controlling interest, classified within Investments and long-term receivables on
our Balance Sheet will be accounted for under the equity method on a prospective basis.
Other, net for 2009 includes an other than-temporary impairment charge of $62 million. See Note 16 Financial Instruments and Fair Value Measures for
further details.
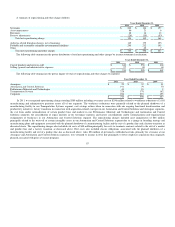
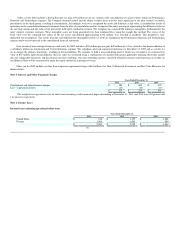
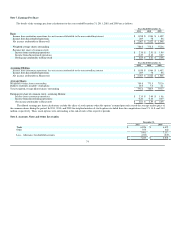
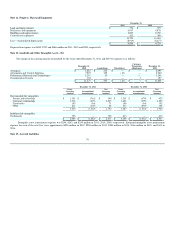
Note 5. Interest and Other Financial Charges
Years Ended December 31,
2011 2010 2009
Total interest and other financial charges $ 389 $ 402 $ 473
Less—capitalized interest (13) (16) (15)
$ 376 $ 386 $ 458
The weighted average interest rate on short-term borrowings and commercial paper outstanding at December 31, 2011 and 2010 was 0.84 percent and
1.64 percent, respectively.
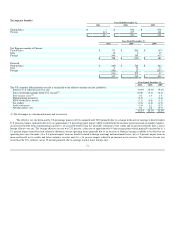
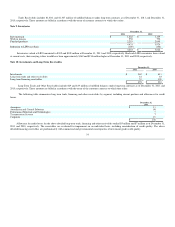
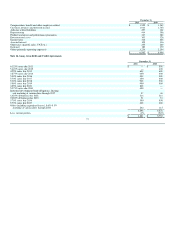
Note 6. Income Taxes
Income from continuing operations before taxes
Years Ended December 31,
2011 2010 2009
United States $ 318 $ 1,157 $ 1,068
Foreign 1,964 1,565 896
$ 2,282 $ 2,722 $ 1,964
70