Honeywell 2011 Annual Report Download - page 88
Download and view the complete annual report
Please find page 88 of the 2011 Honeywell annual report below. You can navigate through the pages in the report by either clicking on the pages listed below, or by using the keyword search tool below to find specific information within the annual report.-
 1
1 -
2
-
3
-
4
-
5
-
6
-
7
-
8
-
9
-
10
-
11
-
12
-
13
-
14
-
15
-
16
-
17
-
18
-
19
-
20
-
21
-
22
-
23
-
24
-
25
-
26
-
27
-
28
-
29
-
30
-
31
-
32
-
33
-
34
-
35
-
36
-
37
-
38
-
39
-
40
-
41
-
42
-
43
-
44
-
45
-
46
-
47
-
48
-
49
-
50
-
51
-
52
-
53
-
54
-
55
-
56
-
57
-
58
-
59
-
60
-
61
-
62
-
63
-
64
-
65
-
66
-
67
-
68
-
69
-
70
-
71
-
72
-
73
-
74
-
75
-
76
-
77
-
 78
78 -
 79
79 -
 80
80 -
 81
81 -
 82
82 -
 83
83 -
 84
84 -
 85
85 -
 86
86 -
 87
87 -
 88
88 -
 89
89 -
 90
90 -
 91
91 -
 92
92 -
 93
93 -
 94
94 -
 95
95 -
 96
96 -
 97
97 -
 98
98 -
99
-
100
-
101
-
102
-
103
-
104
-
105
-
106
-
107
-
108
-
109
-
110
-
111
-
112
-
113
-
114
-
115
-
116
-
117
-
118
-
119
-
120
-
121
-
122
-
123
-
124
-
125
-
126
-
127
-
128
-
129
-
130
-
131
-
132
-
133
-
134
-
135
-
136
-
137
-
138
-
139
-
140
-
141
-
142
-
143
-
144
-
145
-
146
-
147
-
148
-
149
-
150
-
151
-
152
-
153
-
154
-
155
-
156
-
157
-
158
-
159
 |
 |

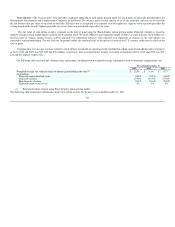
Stock Options—The exercise price, term and other conditions applicable to each option granted under our stock plans are generally determined by the
Management Development and Compensation Committee of the Board. The exercise price of stock options is set on the grant date and may not be less than
the fair market value per share of our stock on that date. The fair value is recognized as an expense over the employee's requisite service period (generally the
vesting period of the award). Options generally vest over a four-year period and expire after ten years.
The fair value of each option award is estimated on the date of grant using the Black-Scholes option-pricing model. Expected volatility is based on
implied volatilities from traded options on Honeywell common stock. We used a Monte Carlo simulation model to derive an expected term. Such model uses
historical data to estimate option exercise activity and post-vest termination behavior. The expected term represents an estimate of the time options are
expected to remain outstanding. The risk-free rate for periods within the contractual life of the option is based on the U.S. treasury yield curve in effect at the
time of grant.
Compensation cost on a pre-tax basis related to stock options recognized in operating results (included in selling, general and administrative expenses)
in 2011, 2010 and 2009 was $59, $55 and $39 million, respectively. The associated future income tax benefit recognized in 2011, 2010 and 2009 was $19,
$16 and $13 million, respectively.
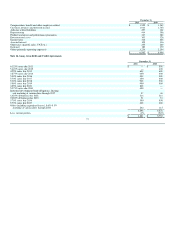
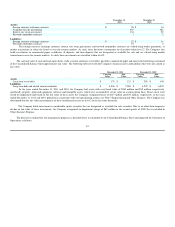
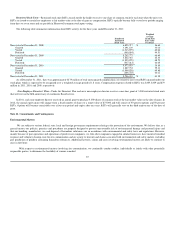
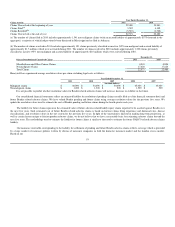
The following table sets forth fair value per share information, including related weighted-average assumptions, used to determine compensation cost:
Years Ended December 31,
2011 2010 2009
Weighted average fair value per share of options granted during the year(1) $ 12.56 $ 8.96 $ 6.73
Assumptions:
Expected annual dividend yield 2.68% 3.00% 4.26%
Expected volatility 27.60% 29.39% 35.78%
Risk-free rate of return 2.47% 2.64% 2.53%
Expected option term (years) 5.8 5.4 5.8
(1) Estimated on date of grant using Black-Scholes option-pricing model.
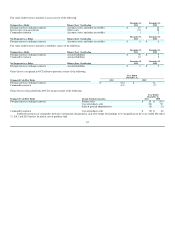
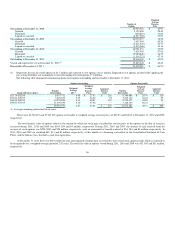
The following table summarizes information about stock option activity for the three years ended December 31, 2011:
85