Hertz 2009 Annual Report Download - page 96
Download and view the complete annual report
Please find page 96 of the 2009 Hertz annual report below. You can navigate through the pages in the report by either clicking on the pages listed below, or by using the keyword search tool below to find specific information within the annual report.-
 1
1 -
2
-
3
-
4
-
5
-
6
-
7
-
8
-
9
-
10
-
11
-
12
-
13
-
14
-
15
-
16
-
17
-
18
-
19
-
20
-
21
-
22
-
23
-
24
-
25
-
26
-
27
-
28
-
29
-
30
-
31
-
32
-
33
-
34
-
35
-
36
-
37
-
38
-
39
-
40
-
41
-
42
-
43
-
44
-
45
-
46
-
47
-
48
-
49
-
50
-
51
-
52
-
53
-
54
-
55
-
56
-
57
-
58
-
59
-
60
-
61
-
62
-
63
-
64
-
65
-
66
-
67
-
68
-
69
-
70
-
71
-
72
-
73
-
74
-
75
-
76
-
77
-
78
-
79
-
80
-
81
-
82
-
83
-
84
-
85
-
 86
86 -
 87
87 -
 88
88 -
 89
89 -
 90
90 -
 91
91 -
 92
92 -
 93
93 -
 94
94 -
 95
95 -
 96
96 -
 97
97 -
 98
98 -
 99
99 -
 100
100 -
 101
101 -
 102
102 -
 103
103 -
 104
104 -
 105
105 -
 106
106 -
107
-
108
-
109
-
110
-
111
-
112
-
113
-
114
-
115
-
116
-
117
-
118
-
119
-
120
-
121
-
122
-
123
-
124
-
125
-
126
-
127
-
128
-
129
-
130
-
131
-
132
-
133
-
134
-
135
-
136
-
137
-
138
-
139
-
140
-
141
-
142
-
143
-
144
-
145
-
146
-
147
-
148
-
149
-
150
-
151
-
152
-
153
-
154
-
155
-
156
-
157
-
158
-
159
-
160
-
161
-
162
-
163
-
164
-
165
-
166
-
167
-
168
-
169
-
170
-
171
-
172
-
173
-
174
-
175
-
176
-
177
-
178
-
179
-
180
-
181
-
182
-
183
-
184
-
185
-
186
-
187
-
188
-
189
-
190
-
191
-
192
-
193
-
194
-
195
-
196
-
197
-
198
-
199
-
200
-
201
-
202
-
203
-
204
-
205
-
206
-
207
-
208
-
209
-
210
-
211
-
212
-
213
-
214
-
215
-
216
-
217
-
218
-
219
-
220
-
221
-
222
-
223
-
224
-
225
-
226
-
227
-
228
-
229
-
230
-
231
-
232
 |
 |
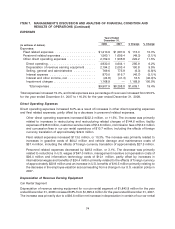
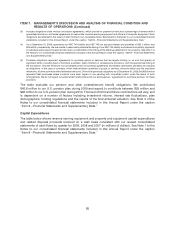
ITEM 7. MANAGEMENT’S DISCUSSION AND ANALYSIS OF FINANCIAL CONDITION AND
RESULTS OF OPERATIONS (Continued)
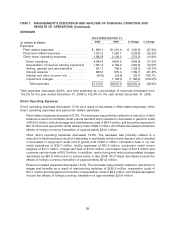
due to a decrease in weighted average interest rate on our borrowings and a decrease in the weighted
average debt outstanding.
Interest and Other Income, Net
Consolidated interest and other income, net decreased 40.0% due to a decrease in interest income as a
result of lower consolidated cash balances during the period.
Impairment Charges
Impairment charges represent non-cash impairment charges incurred during the fourth quarter of 2008
relating to our goodwill, other intangible assets and property and equipment. See Notes 1 and 2 to the
Notes to our consolidated financial statements included in this Annual Report under the caption
‘‘Item 8—Financial Statements and Supplementary Data.’’
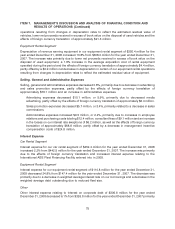
Adjusted Pre-Tax Income
Car Rental Segment
Adjusted pre-tax income for our car rental segment of $289.1 million decreased 52.2% from
$605.0 million for the year ended December 31, 2007. The decrease was primarily due to lower RPD, the
decrease in car rental transaction days worldwide, higher fleet related costs, increases in other operating
costs and lower net proceeds received in excess of book value on the disposal of used vehicles.
Adjustments to our car rental segment income before income taxes and noncontrolling interest on a
GAAP basis for the years ended December 31, 2008 and 2007, totaled $674.4 million and $136.4 million,
respectively. See footnote c to the table under ‘‘Results of Operations’’ for a summary and description of
these adjustments.
Equipment Rental Segment
Adjusted pre-tax income for our equipment rental segment of $272.0 million decreased 27.2% from
$373.8 million for the year ended December 31, 2007. The decrease was primarily due a decrease in
volume and pricing, higher fleet related costs and lower net proceeds received in excess of book value
on the disposal of used equipment. Adjustments to our equipment rental segment income before
income taxes and noncontrolling interest on a GAAP basis for the years ended December 31, 2008 and
2007, totaled $901.3 million and $65.3 million, respectively. See footnote c to the table under ‘‘Results of
Operations’’ for a summary and description of these adjustments.
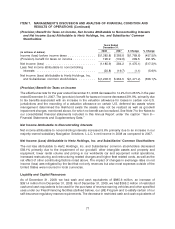
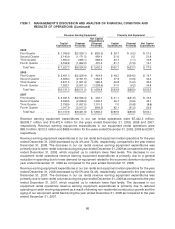
Ratio of Adjusted Pre-Tax Income to Revenues
Adjusted pre-tax income for our car rental segment as a percent of its revenues decreased from 8.7% in
2007 to 4.2% in 2008. Adjusted pre-tax income for our equipment rental segment as a percent of its
revenues decreased from 21.3% in 2007 to 16.4% in 2008.
The ratio of adjusted pre-tax income to revenues for our two segments reflects the different
environments in which they operate. Our infrastructure costs are higher within our car rental segment
due to the number and type of locations in which it operates and the corresponding headcount. Within
our equipment rental segment, our revenue earning equipment generates lower depreciation expense
due to its longer estimated useful life.
76