Hertz 2009 Annual Report Download - page 90
Download and view the complete annual report
Please find page 90 of the 2009 Hertz annual report below. You can navigate through the pages in the report by either clicking on the pages listed below, or by using the keyword search tool below to find specific information within the annual report.-
 1
1 -
2
-
3
-
4
-
5
-
6
-
7
-
8
-
9
-
10
-
11
-
12
-
13
-
14
-
15
-
16
-
17
-
18
-
19
-
20
-
21
-
22
-
23
-
24
-
25
-
26
-
27
-
28
-
29
-
30
-
31
-
32
-
33
-
34
-
35
-
36
-
37
-
38
-
39
-
40
-
41
-
42
-
43
-
44
-
45
-
46
-
47
-
48
-
49
-
50
-
51
-
52
-
53
-
54
-
55
-
56
-
57
-
58
-
59
-
60
-
61
-
62
-
63
-
64
-
65
-
66
-
67
-
68
-
69
-
70
-
71
-
72
-
73
-
74
-
75
-
76
-
77
-
78
-
79
-
 80
80 -
 81
81 -
 82
82 -
 83
83 -
 84
84 -
 85
85 -
 86
86 -
 87
87 -
 88
88 -
 89
89 -
 90
90 -
 91
91 -
 92
92 -
 93
93 -
 94
94 -
 95
95 -
 96
96 -
 97
97 -
 98
98 -
 99
99 -
 100
100 -
101
-
102
-
103
-
104
-
105
-
106
-
107
-
108
-
109
-
110
-
111
-
112
-
113
-
114
-
115
-
116
-
117
-
118
-
119
-
120
-
121
-
122
-
123
-
124
-
125
-
126
-
127
-
128
-
129
-
130
-
131
-
132
-
133
-
134
-
135
-
136
-
137
-
138
-
139
-
140
-
141
-
142
-
143
-
144
-
145
-
146
-
147
-
148
-
149
-
150
-
151
-
152
-
153
-
154
-
155
-
156
-
157
-
158
-
159
-
160
-
161
-
162
-
163
-
164
-
165
-
166
-
167
-
168
-
169
-
170
-
171
-
172
-
173
-
174
-
175
-
176
-
177
-
178
-
179
-
180
-
181
-
182
-
183
-
184
-
185
-
186
-
187
-
188
-
189
-
190
-
191
-
192
-
193
-
194
-
195
-
196
-
197
-
198
-
199
-
200
-
201
-
202
-
203
-
204
-
205
-
206
-
207
-
208
-
209
-
210
-
211
-
212
-
213
-
214
-
215
-
216
-
217
-
218
-
219
-
220
-
221
-
222
-
223
-
224
-
225
-
226
-
227
-
228
-
229
-
230
-
231
-
232
 |
 |
ITEM 7. MANAGEMENT’S DISCUSSION AND ANALYSIS OF FINANCIAL CONDITION AND
RESULTS OF OPERATIONS (Continued)
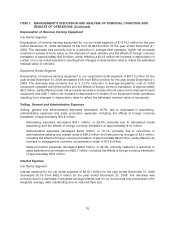
Depreciation of Revenue Earning Equipment
Car Rental Segment
Depreciation of revenue earning equipment for our car rental segment of $1,614.2 million for the year
ended December 31, 2009 decreased 12.5% from $1,843.8 million for the year ended December 31,
2008. The decrease was primarily due to a reduction in average fleet operated, higher net proceeds
received in excess of book value on the disposal of used vehicles and the effects of foreign currency
translation of approximately $42.8 million, partly offset by a $13.2 million net increase in depreciation in
certain of our car rental operations resulting from changes in depreciation rates to reflect the estimated
residual value of vehicles.
Equipment Rental Segment
Depreciation of revenue earning equipment in our equipment rental segment of $317.2 million for the
year ended December 31, 2009 decreased 9.5% from $350.4 million for the year ended December 31,
2008. The decrease was primarily due to a 14.7% reduction in average acquisition cost of rental
equipment operated during the period and the effects of foreign currency translation of approximately
$6.2 million, partly offset by lower net proceeds received in excess of book value on the disposal of used
equipment and a $6.1 million net increase in depreciation in certain of our equipment rental operations
resulting from changes in depreciation rates to reflect the estimated residual value of equipment.
Selling, General and Administrative Expenses
Selling, general and administrative expenses decreased 16.7%, due to decreases in advertising,
administrative expenses and sales promotion expenses, including the effects of foreign currency
translation of approximately $15.8 million.
Advertising expenses decreased $47.1 million, or 29.4%, primarily due to decreased media
advertising and the effects of foreign currency translation of approximately $1.0 million.
Administrative expenses decreased $44.8 million, or 10.1%, primarily due to reductions in
administrative salaries and related costs of $59.5 million and restructuring charges of $3.2 million,
including the effects of foreign currency translation of approximately $9.6 million, partly offset by an
increase in management incentive compensation costs of $13.6 million.
Sales promotion expenses decreased $36.6 million, or 22.4%, primarily related to a reduction in
sales salaries and commissions of $26.7 million, including the effects of foreign currency translation
of approximately $5.2 million.
Interest Expense
Car Rental Segment
Interest expense for our car rental segment of $316.1 million for the year ended December 31, 2009
decreased 30.1% from $452.4 million for the year ended December 31, 2008. The decrease was
primarily due to a decrease in weighted average interest rate on our borrowings and a decrease in the
weighted average debt outstanding due to reduced fleet size.
70