Hertz 2009 Annual Report Download - page 105
Download and view the complete annual report
Please find page 105 of the 2009 Hertz annual report below. You can navigate through the pages in the report by either clicking on the pages listed below, or by using the keyword search tool below to find specific information within the annual report.-
 1
1 -
2
-
3
-
4
-
5
-
6
-
7
-
8
-
9
-
10
-
11
-
12
-
13
-
14
-
15
-
16
-
17
-
18
-
19
-
20
-
21
-
22
-
23
-
24
-
25
-
26
-
27
-
28
-
29
-
30
-
31
-
32
-
33
-
34
-
35
-
36
-
37
-
38
-
39
-
40
-
41
-
42
-
43
-
44
-
45
-
46
-
47
-
48
-
49
-
50
-
51
-
52
-
53
-
54
-
55
-
56
-
57
-
58
-
59
-
60
-
61
-
62
-
63
-
64
-
65
-
66
-
67
-
68
-
69
-
70
-
71
-
72
-
73
-
74
-
75
-
76
-
77
-
78
-
79
-
80
-
81
-
82
-
83
-
84
-
85
-
86
-
87
-
88
-
89
-
90
-
91
-
92
-
93
-
94
-
 95
95 -
 96
96 -
 97
97 -
 98
98 -
 99
99 -
 100
100 -
 101
101 -
 102
102 -
 103
103 -
 104
104 -
 105
105 -
 106
106 -
 107
107 -
 108
108 -
 109
109 -
 110
110 -
 111
111 -
 112
112 -
 113
113 -
 114
114 -
 115
115 -
116
-
117
-
118
-
119
-
120
-
121
-
122
-
123
-
124
-
125
-
126
-
127
-
128
-
129
-
130
-
131
-
132
-
133
-
134
-
135
-
136
-
137
-
138
-
139
-
140
-
141
-
142
-
143
-
144
-
145
-
146
-
147
-
148
-
149
-
150
-
151
-
152
-
153
-
154
-
155
-
156
-
157
-
158
-
159
-
160
-
161
-
162
-
163
-
164
-
165
-
166
-
167
-
168
-
169
-
170
-
171
-
172
-
173
-
174
-
175
-
176
-
177
-
178
-
179
-
180
-
181
-
182
-
183
-
184
-
185
-
186
-
187
-
188
-
189
-
190
-
191
-
192
-
193
-
194
-
195
-
196
-
197
-
198
-
199
-
200
-
201
-
202
-
203
-
204
-
205
-
206
-
207
-
208
-
209
-
210
-
211
-
212
-
213
-
214
-
215
-
216
-
217
-
218
-
219
-
220
-
221
-
222
-
223
-
224
-
225
-
226
-
227
-
228
-
229
-
230
-
231
-
232
 |
 |
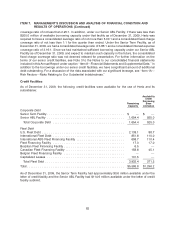
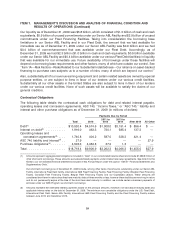
ITEM 7. MANAGEMENT’S DISCUSSION AND ANALYSIS OF FINANCIAL CONDITION AND
RESULTS OF OPERATIONS (Continued)
(3) Includes obligations under various concession agreements, which provide for payment of rents and a percentage of revenue with a
guaranteed minimum, and lease agreements for real estate, revenue earning equipment and office and computer equipment. Such
obligations are reflected to the extent of their minimum non-cancelable terms. See Note 8 to the Notes to our consolidated financial
statements included in this Annual Report under the caption ‘‘Item 8—Financial Statements and Supplementary Data.’’
(4) As of December 31, 2009, represents our ASC 740 liability and ASC 740 net accrued interest and penalties of $22.1 million and
$5.8 million, respectively. We are unable to reasonably estimate the timing of our ASC 740 liability and interest and penalty payments
in individual years beyond twelve months due to uncertainties in the timing of the effective settlement of tax positions. See Note 7 to
the Notes to our consolidated financial statements included in this Annual Report under the caption ‘‘Item 8—Financial Statements
and Supplementary Data.’’
(5) Purchase obligations represent agreements to purchase goods or services that are legally binding on us and that specify all
significant terms, including fixed or minimum quantities; fixed, minimum or variable price provisions; and the approximate timing of
the transaction. Only the minimum non-cancelable portion of purchase agreements and related cancellation penalties are included
as obligations. In the case of contracts, which state minimum quantities of goods or services, amounts reflect only the stipulated
minimums; all other contracts reflect estimated amounts. Of the total purchase obligations as of December 31, 2009, $4,365.8 million
represent fleet purchases where contracts have been signed or are pending with committed orders under the terms of such
arrangements. We do not regard our employment relationships with our employees as ‘‘agreements to purchase services’’ for these
purposes.
The table excludes our pension and other postretirement benefit obligations. We contributed
$42.6 million to our U.S. pension plan during 2009 and expect to contribute between $25 million and
$95 million to our U.S. pension plan during 2010. The level of 2010 and future contributions will vary, and
is dependent on a number of factors including investment returns, interest rate fluctuations, plan
demographics, funding regulations and the results of the final actuarial valuation. See Note 4 of the
Notes to our consolidated financial statements included in this Annual Report under the caption
‘‘Item 8—Financial Statements and Supplementary Data.’’
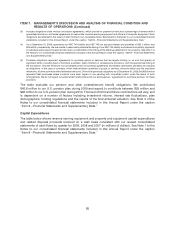
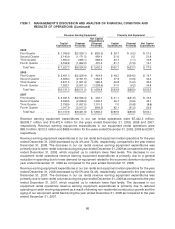
Capital Expenditures
The table below shows revenue earning equipment and property and equipment capital expenditures
and related disposal proceeds received on a cash basis consistent with our revised consolidated
statements of cash flows by quarter for 2009, 2008 and 2007 (in millions of dollars). See Note 1 to the
Notes to our consolidated financial statements included in this Annual Report under the caption
‘‘Item 8—Financial Statements and Supplementary Data.’’
85