Hertz 2009 Annual Report Download - page 94
Download and view the complete annual report
Please find page 94 of the 2009 Hertz annual report below. You can navigate through the pages in the report by either clicking on the pages listed below, or by using the keyword search tool below to find specific information within the annual report.-
 1
1 -
2
-
3
-
4
-
5
-
6
-
7
-
8
-
9
-
10
-
11
-
12
-
13
-
14
-
15
-
16
-
17
-
18
-
19
-
20
-
21
-
22
-
23
-
24
-
25
-
26
-
27
-
28
-
29
-
30
-
31
-
32
-
33
-
34
-
35
-
36
-
37
-
38
-
39
-
40
-
41
-
42
-
43
-
44
-
45
-
46
-
47
-
48
-
49
-
50
-
51
-
52
-
53
-
54
-
55
-
56
-
57
-
58
-
59
-
60
-
61
-
62
-
63
-
64
-
65
-
66
-
67
-
68
-
69
-
70
-
71
-
72
-
73
-
74
-
75
-
76
-
77
-
78
-
79
-
80
-
81
-
82
-
83
-
 84
84 -
 85
85 -
 86
86 -
 87
87 -
 88
88 -
 89
89 -
 90
90 -
 91
91 -
 92
92 -
 93
93 -
 94
94 -
 95
95 -
 96
96 -
 97
97 -
 98
98 -
 99
99 -
 100
100 -
 101
101 -
 102
102 -
 103
103 -
 104
104 -
105
-
106
-
107
-
108
-
109
-
110
-
111
-
112
-
113
-
114
-
115
-
116
-
117
-
118
-
119
-
120
-
121
-
122
-
123
-
124
-
125
-
126
-
127
-
128
-
129
-
130
-
131
-
132
-
133
-
134
-
135
-
136
-
137
-
138
-
139
-
140
-
141
-
142
-
143
-
144
-
145
-
146
-
147
-
148
-
149
-
150
-
151
-
152
-
153
-
154
-
155
-
156
-
157
-
158
-
159
-
160
-
161
-
162
-
163
-
164
-
165
-
166
-
167
-
168
-
169
-
170
-
171
-
172
-
173
-
174
-
175
-
176
-
177
-
178
-
179
-
180
-
181
-
182
-
183
-
184
-
185
-
186
-
187
-
188
-
189
-
190
-
191
-
192
-
193
-
194
-
195
-
196
-
197
-
198
-
199
-
200
-
201
-
202
-
203
-
204
-
205
-
206
-
207
-
208
-
209
-
210
-
211
-
212
-
213
-
214
-
215
-
216
-
217
-
218
-
219
-
220
-
221
-
222
-
223
-
224
-
225
-
226
-
227
-
228
-
229
-
230
-
231
-
232
 |
 |

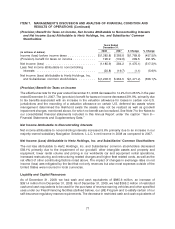
ITEM 7. MANAGEMENT’S DISCUSSION AND ANALYSIS OF FINANCIAL CONDITION AND
RESULTS OF OPERATIONS (Continued)
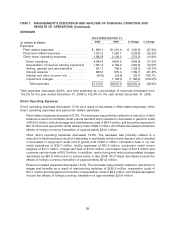
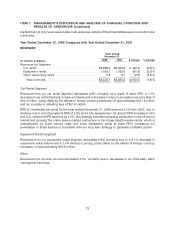
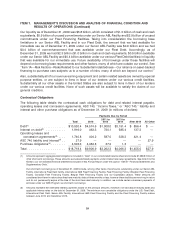
EXPENSES
Years Ended
December 31,
2008 2007 $ Change % Change
(in millions of dollars)
Expenses:
Fleet related expenses ...................... $1,210.9 $1,097.9 $ 113.0 10.3%
Personnel related expenses ................... 1,560.1 1,609.4 (49.3) (3.1)%
Other direct operating expenses ............... 2,159.0 1,936.8 222.2 11.5%
Direct operating .......................... 4,930.0 4,644.1 285.9 6.2%
Depreciation of revenue earning equipment ...... 2,194.2 2,003.4 190.8 9.5%
Selling, general and administrative ............ 769.6 775.9 (6.3) (0.8)%
Interest expense ......................... 870.0 916.7 (46.7) (5.1)%
Interest and other income, net ............... (24.8) (41.3) 16.5 (40.0)%
Impairment charges ....................... 1,168.9 — 1,168.9 100.0%
Total expenses ......................... $9,907.9 $8,298.8 $1,609.1 19.4%
Total expenses increased 19.4%, and total expenses as a percentage of revenues increased from 95.5%
for the year ended December 31, 2007 to 116.2% for the year ended December 31, 2008.
Direct Operating Expenses
Direct operating expenses increased 6.2% as a result of increases in other direct operating expenses
and fleet related expenses, partly offset by a decrease in personnel related expenses.
Other direct operating expenses increased $222.2 million, or 11.5%. The increase was primarily
related to increases in restructuring and restructuring related charges of $144.6 million, facility
expenses of $46.6 million, customer service costs of $14.6 million, commission fees of $14.0 million
and concession fees in our car rental operations of $10.7 million, including the effects of foreign
currency translation of approximately $29.9 million.
Fleet related expenses increased $113.0 million, or 10.3%. The increase was primarily related to
increases in gasoline costs of $64.2 million and vehicle damage and maintenance costs of
$57.4 million, including the effects of foreign currency translation of approximately $27.5 million.
Personnel related expenses decreased by $49.3 million, or 3.1%. The decrease was primarily
related to reductions in U.S. wages of $47.0 million, management incentive compensation costs of
$26.4 million and information technology costs of $10.1 million, partly offset by increases in
international wages and benefits of $24.4 million primarily related to the effects of foreign currency
of approximately $20.9 million and an increase in U.S. benefits of $16.5 million primarily relating to
the decrease in the employee vacation accrual resulting from a change in our U.S. vacation policy in
2007.
Depreciation of Revenue Earning Equipment
Car Rental Segment
Depreciation of revenue earning equipment for our car rental segment of $1,843.8 million for the year
ended December 31, 2008 increased 8.8% from $1,695.4 million for the year ended December 31, 2007.
The increase was primarily due to a $36.6 million net increase in depreciation in certain of our car rental
74