Hertz 2009 Annual Report Download - page 106
Download and view the complete annual report
Please find page 106 of the 2009 Hertz annual report below. You can navigate through the pages in the report by either clicking on the pages listed below, or by using the keyword search tool below to find specific information within the annual report.-
 1
1 -
2
-
3
-
4
-
5
-
6
-
7
-
8
-
9
-
10
-
11
-
12
-
13
-
14
-
15
-
16
-
17
-
18
-
19
-
20
-
21
-
22
-
23
-
24
-
25
-
26
-
27
-
28
-
29
-
30
-
31
-
32
-
33
-
34
-
35
-
36
-
37
-
38
-
39
-
40
-
41
-
42
-
43
-
44
-
45
-
46
-
47
-
48
-
49
-
50
-
51
-
52
-
53
-
54
-
55
-
56
-
57
-
58
-
59
-
60
-
61
-
62
-
63
-
64
-
65
-
66
-
67
-
68
-
69
-
70
-
71
-
72
-
73
-
74
-
75
-
76
-
77
-
78
-
79
-
80
-
81
-
82
-
83
-
84
-
85
-
86
-
87
-
88
-
89
-
90
-
91
-
92
-
93
-
94
-
95
-
 96
96 -
 97
97 -
 98
98 -
 99
99 -
 100
100 -
 101
101 -
 102
102 -
 103
103 -
 104
104 -
 105
105 -
 106
106 -
 107
107 -
 108
108 -
 109
109 -
 110
110 -
 111
111 -
 112
112 -
 113
113 -
 114
114 -
 115
115 -
 116
116 -
117
-
118
-
119
-
120
-
121
-
122
-
123
-
124
-
125
-
126
-
127
-
128
-
129
-
130
-
131
-
132
-
133
-
134
-
135
-
136
-
137
-
138
-
139
-
140
-
141
-
142
-
143
-
144
-
145
-
146
-
147
-
148
-
149
-
150
-
151
-
152
-
153
-
154
-
155
-
156
-
157
-
158
-
159
-
160
-
161
-
162
-
163
-
164
-
165
-
166
-
167
-
168
-
169
-
170
-
171
-
172
-
173
-
174
-
175
-
176
-
177
-
178
-
179
-
180
-
181
-
182
-
183
-
184
-
185
-
186
-
187
-
188
-
189
-
190
-
191
-
192
-
193
-
194
-
195
-
196
-
197
-
198
-
199
-
200
-
201
-
202
-
203
-
204
-
205
-
206
-
207
-
208
-
209
-
210
-
211
-
212
-
213
-
214
-
215
-
216
-
217
-
218
-
219
-
220
-
221
-
222
-
223
-
224
-
225
-
226
-
227
-
228
-
229
-
230
-
231
-
232
 |
 |

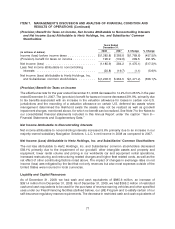
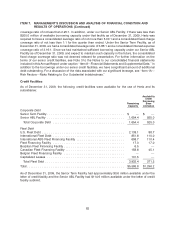
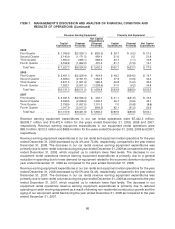
ITEM 7. MANAGEMENT’S DISCUSSION AND ANALYSIS OF FINANCIAL CONDITION AND
RESULTS OF OPERATIONS (Continued)
Revenue Earning Equipment Property and Equipment
Net Capital
Expenditures
Capital Disposal (Disposal Capital Disposal Net Capital
Expenditures Proceeds Proceeds) Expenditures Proceeds Expenditures
2009
First Quarter .......... $ 1,399.6 $(2,026.1) $ (626.5) $ 26.7 $ (5.2) $ 21.5
Second Quarter ....... 2,140.9 (1,171.5) 969.4 21.6 0.2 21.8
Third Quarter ......... 1,654.0 (965.1) 688.9 20.7 (1.1) 19.6
Fourth Quarter ........ 2,332.8 (1,862.2) 470.6 31.7 (17.6) 14.1
Total Year .......... $ 7,527.3 $(6,024.9) $ 1,502.4 $100.7 $(23.7) $ 77.0
2008
First Quarter .......... $ 2,451.0 $(2,026.4) $ 424.6 $ 48.2 $(34.5) $ 13.7
Second Quarter ....... 3,626.4 (2,161.9) 1,464.5 47.8 (13.6) 34.2
Third Quarter ......... 2,811.5 (1,821.9) 989.6 56.8 (14.2) 42.6
Fourth Quarter ........ 1,262.1 (2,501.0) (1,238.9) 41.0 (6.2) 34.8
Total Year .......... $10,151.0 $(8,511.2) $ 1,639.8 $193.8 $(68.5) $125.3
2007
First Quarter .......... $ 2,941.5 $(2,508.4) $ 433.1 $ 41.1 $(21.9) $ 19.2
Second Quarter ....... 3,539.5 (2,238.6) 1,300.9 59.7 (16.6) 43.1
Third Quarter ......... 2,758.9 (1,657.6) 1,101.3 7.0 (15.8) (8.8)
Fourth Quarter ........ 1,917.9 (2,917.2) (999.3) 82.1 (31.5) 50.6
Total Year .......... $11,157.8 $(9,321.8) $ 1,836.0 $189.9 $(85.8) $104.1
Revenue earning equipment expenditures in our car rental operations were $7,442.3 million,
$9,838.7 million and $10,472.4 million for the years ended December 31, 2009, 2008 and 2007,
respectively. Revenue earning equipment expenditures in our equipment rental operations were
$85.0 million, $312.3 million and $685.4 million for the years ended December 31, 2009, 2008 and 2007,
respectively.
Revenue earning equipment expenditures in our car rental and equipment rental operations for the year
ended December 31, 2009 decreased by 24.4% and 72.8%, respectively, compared to the year ended
December 31, 2008. The decrease in our car rental revenue earning equipment expenditures was
primarily due to lower rental volumes during the year ended December 31, 2009 as compared to the year
ended December 31, 2008, which required us to maintain lower fleet levels. The decrease in our
equipment rental operations revenue earning equipment expenditures is primarily due to a general
reduction in spending due to lower demand for equipment related to the economic downturn during the
year ended December 31, 2009 as compared to the year ended December 31, 2008.
Revenue earning equipment expenditures in our car rental and equipment rental operations for the year
ended December 31, 2008 decreased by 60.5% and 54.4%, respectively, compared to the year ended
December 31, 2007. The decrease in our car rental revenue earning equipment expenditures was
primarily due to lower rental volumes during the year ended December 31, 2008 as compared to the year
ended December 31, 2007, which required us to maintain lower fleet levels. The decrease in our
equipment rental operations revenue earning equipment expenditures is primarily due to reduced
spending on earth moving equipment as a result of slowing non-residential construction growth and the
aging of our equipment rental fleet during the year ended December 31, 2008 as compared to the year
ended December 31, 2007.
86