Hertz 2009 Annual Report Download - page 118
Download and view the complete annual report
Please find page 118 of the 2009 Hertz annual report below. You can navigate through the pages in the report by either clicking on the pages listed below, or by using the keyword search tool below to find specific information within the annual report.-
 1
1 -
2
-
3
-
4
-
5
-
6
-
7
-
8
-
9
-
10
-
11
-
12
-
13
-
14
-
15
-
16
-
17
-
18
-
19
-
20
-
21
-
22
-
23
-
24
-
25
-
26
-
27
-
28
-
29
-
30
-
31
-
32
-
33
-
34
-
35
-
36
-
37
-
38
-
39
-
40
-
41
-
42
-
43
-
44
-
45
-
46
-
47
-
48
-
49
-
50
-
51
-
52
-
53
-
54
-
55
-
56
-
57
-
58
-
59
-
60
-
61
-
62
-
63
-
64
-
65
-
66
-
67
-
68
-
69
-
70
-
71
-
72
-
73
-
74
-
75
-
76
-
77
-
78
-
79
-
80
-
81
-
82
-
83
-
84
-
85
-
86
-
87
-
88
-
89
-
90
-
91
-
92
-
93
-
94
-
95
-
96
-
97
-
98
-
99
-
100
-
101
-
102
-
103
-
104
-
105
-
106
-
107
-
 108
108 -
 109
109 -
 110
110 -
 111
111 -
 112
112 -
 113
113 -
 114
114 -
 115
115 -
 116
116 -
 117
117 -
 118
118 -
 119
119 -
 120
120 -
 121
121 -
 122
122 -
 123
123 -
 124
124 -
 125
125 -
 126
126 -
 127
127 -
 128
128 -
129
-
130
-
131
-
132
-
133
-
134
-
135
-
136
-
137
-
138
-
139
-
140
-
141
-
142
-
143
-
144
-
145
-
146
-
147
-
148
-
149
-
150
-
151
-
152
-
153
-
154
-
155
-
156
-
157
-
158
-
159
-
160
-
161
-
162
-
163
-
164
-
165
-
166
-
167
-
168
-
169
-
170
-
171
-
172
-
173
-
174
-
175
-
176
-
177
-
178
-
179
-
180
-
181
-
182
-
183
-
184
-
185
-
186
-
187
-
188
-
189
-
190
-
191
-
192
-
193
-
194
-
195
-
196
-
197
-
198
-
199
-
200
-
201
-
202
-
203
-
204
-
205
-
206
-
207
-
208
-
209
-
210
-
211
-
212
-
213
-
214
-
215
-
216
-
217
-
218
-
219
-
220
-
221
-
222
-
223
-
224
-
225
-
226
-
227
-
228
-
229
-
230
-
231
-
232
 |
 |

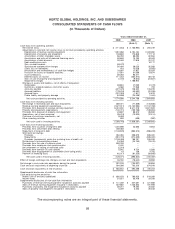
HERTZ GLOBAL HOLDINGS, INC. AND SUBSIDIARIES
CONSOLIDATED STATEMENTS OF CASH FLOWS
(In Thousands of Dollars)
Years ended December 31,
2009 2008 2007
(Note 1) (Note 1)
Cash flows from operating activities:
Net income (loss) ............................................ $ (111,343) $ (1,185,960) $ 284,249
Adjustments to reconcile net income (loss) to net cash provided by operating activities:
Depreciation of revenue earning equipment ........................... 1,931,358 2,194,164 2,003,360
Depreciation of property and equipment ............................. 159,693 172,848 177,113
Amortization of other intangible assets .............................. 66,059 66,282 62,594
Amortization and write-off of deferred financing costs ...................... 58,849 70,193 48,409
Amortization of debt discount .................................... 38,458 17,908 20,747
Debt modification costs ....................................... ——16,177
Gain on debt buyback ........................................ (48,472) ——
Stock-based compensation charges ................................ 35,464 28,023 32,939
(Gain) loss on derivatives ...................................... 418 12,058 (3,925)
Amortization and ineffectiveness of cash flow hedges ...................... 74,597 11,807 20,424
Provision for losses on doubtful accounts ............................. 27,951 31,068 13,874
Asset writedowns ........................................... 36,063 93,211 —
Deferred taxes on income ...................................... 111,233 (234,810) 59,743
Gain on sale of property and equipment ............................. (1,072) (9,602) (24,807)
Impairment charges ......................................... — 1,168,900 —
Changes in assets and liabilities, net of effects of acquisition:
Receivables .............................................. 38,634 47,063 (2,073)
Inventories, prepaid expenses and other assets ......................... 5,568 17,956 709
Accounts payable .......................................... (227,479) 108,530 105,979
Accrued liabilities ........................................... (179,416) (43,582) (20,299)
Accrued taxes ............................................. (207,029) (1,801) 10,875
Public liability and property damage ................................ (34,536) (20,068) (1,405)
Net cash provided by operating activities ............................ 1,774,998 2,544,188 2,804,683
Cash flows from investing activities:
Net change in restricted cash and cash equivalents ........................ 368,721 (71,836) (105,856)
Revenue earning equipment expenditures .............................. (7,527,317) (10,150,982) (11,157,763)
Proceeds from disposal of revenue earning equipment ...................... 6,024,940 8,511,216 9,321,823
Property and equipment expenditures ................................ (100,701) (193,766) (189,954)
Proceeds from disposal of property and equipment ........................ 23,697 68,515 85,826
Acquisitions, net of cash acquired .................................. (76,419) (70,920) (12,514)
Purchase of short-term investments, net ............................... (3,492) ——
Other investing activities ........................................ 828 (488) (362)
Net cash used in investing activities ............................... (1,289,743) (1,908,261) (2,058,800)
Cash flows from financing activities:
Proceeds from issuance of long-term debt ............................. 1,200,896 22,565 9,903
Proceeds from convertible debt offering ............................... 459,483 ——
Repayment of long-term debt ..................................... (1,149,876) (860,515) (996,203)
Short-term borrowings:
Proceeds ............................................... 364,065 396,679 695,000
Repayments .............................................. (351,773) (374,333) (695,000)
Proceeds (repayments) under the revolving lines of credit, net ................. (1,126,099) 198,761 295,229
Distributions to noncontrolling interest ................................ (15,050) (24,150) (13,475)
Proceeds from the sale of common stock .............................. 528,758 ——
Proceeds from employee stock purchase plan ........................... 2,400 ——
Net settlement on vesting of restricted stock ............................ (2,219) ——
Proceeds from exercise of stock options ............................... 5,342 6,754 5,599
Proceeds from disgorgement of stockholder short-swing profits ................. 19 138 4,755
Payment of financing costs ...................................... (45,017) (61,223) (39,895)
Net cash used in financing activities ............................... (129,071) (695,324) (734,087)
Effect of foreign exchange rate changes on cash and cash equivalents .............. 35,192 (76,540) 43,858
Net change in cash and cash equivalents during the period ..................... 391,376 (135,937) 55,654
Cash and cash equivalents at beginning of period .......................... 594,266 730,203 674,549
Cash and cash equivalents at end of period .............................. $ 985,642 $ 594,266 $ 730,203
Supplemental disclosures of cash flow information:
Cash paid during the period for:
Interest (net of amounts capitalized) ................................. $ 635,153 $ 763,953 $ 814,059
Income taxes .............................................. 31,321 33,408 28,293
Supplemental disclosures of non-cash flow information:
Purchases of revenue earning equipment included in accounts payable ............ $ 141,039 $ 347,581 $ 421,886
Sales of revenue earning equipment included in receivables ................... 537,862 1,025,832 731,993
Purchases of property and equipment included in accounts payable .............. 38,210 19,490 34,582
Sales of property and equipment included in receivables ..................... 5,229 2,452 30,543
The accompanying notes are an integral part of these financial statements.
98