Hertz 2009 Annual Report Download - page 150
Download and view the complete annual report
Please find page 150 of the 2009 Hertz annual report below. You can navigate through the pages in the report by either clicking on the pages listed below, or by using the keyword search tool below to find specific information within the annual report.-
 1
1 -
2
-
3
-
4
-
5
-
6
-
7
-
8
-
9
-
10
-
11
-
12
-
13
-
14
-
15
-
16
-
17
-
18
-
19
-
20
-
21
-
22
-
23
-
24
-
25
-
26
-
27
-
28
-
29
-
30
-
31
-
32
-
33
-
34
-
35
-
36
-
37
-
38
-
39
-
40
-
41
-
42
-
43
-
44
-
45
-
46
-
47
-
48
-
49
-
50
-
51
-
52
-
53
-
54
-
55
-
56
-
57
-
58
-
59
-
60
-
61
-
62
-
63
-
64
-
65
-
66
-
67
-
68
-
69
-
70
-
71
-
72
-
73
-
74
-
75
-
76
-
77
-
78
-
79
-
80
-
81
-
82
-
83
-
84
-
85
-
86
-
87
-
88
-
89
-
90
-
91
-
92
-
93
-
94
-
95
-
96
-
97
-
98
-
99
-
100
-
101
-
102
-
103
-
104
-
105
-
106
-
107
-
108
-
109
-
110
-
111
-
112
-
113
-
114
-
115
-
116
-
117
-
118
-
119
-
120
-
121
-
122
-
123
-
124
-
125
-
126
-
127
-
128
-
129
-
130
-
131
-
132
-
133
-
134
-
135
-
136
-
137
-
138
-
139
-
 140
140 -
 141
141 -
 142
142 -
 143
143 -
 144
144 -
 145
145 -
 146
146 -
 147
147 -
 148
148 -
 149
149 -
 150
150 -
 151
151 -
 152
152 -
 153
153 -
 154
154 -
 155
155 -
 156
156 -
 157
157 -
 158
158 -
 159
159 -
 160
160 -
161
-
162
-
163
-
164
-
165
-
166
-
167
-
168
-
169
-
170
-
171
-
172
-
173
-
174
-
175
-
176
-
177
-
178
-
179
-
180
-
181
-
182
-
183
-
184
-
185
-
186
-
187
-
188
-
189
-
190
-
191
-
192
-
193
-
194
-
195
-
196
-
197
-
198
-
199
-
200
-
201
-
202
-
203
-
204
-
205
-
206
-
207
-
208
-
209
-
210
-
211
-
212
-
213
-
214
-
215
-
216
-
217
-
218
-
219
-
220
-
221
-
222
-
223
-
224
-
225
-
226
-
227
-
228
-
229
-
230
-
231
-
232
 |
 |

HERTZ GLOBAL HOLDINGS, INC. AND SUBSIDIARIES
NOTES TO CONSOLIDATED FINANCIAL STATEMENTS (Continued)
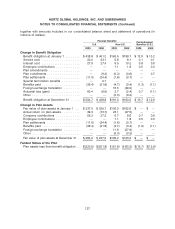
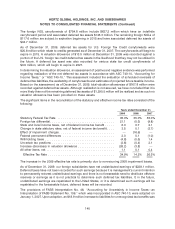
Changing the assumed health care cost trend rates by one percentage point is estimated to have the
following effects (in millions of dollars):
One Percentage Point
Increase Decrease
Effect on total of service and interest cost components ......... $0.0 $0.0
Effect on postretirement benefit obligation ................... $0.4 $(0.4)
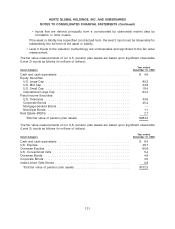
The provisions charged to income for the years ended December 31, 2009, 2008 and 2007 for all other
pension plans were approximately (in millions of dollars) $7.3, $8.0 and $7.8, respectively.
The provisions charged to income for the years ended December 31, 2009, 2008 and 2007 for the
defined contribution plans were approximately (in millions of dollars) $6.9, $16.3 and $15.6, respectively.
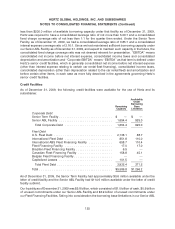
Plan Assets
We have a long-term investment outlook for the assets held in our Company sponsored plans, which is
consistent with the long-term nature of each plan’s respective liabilities. We have two major plans which
reside in the U.S. and the U.K.
The U.S. Plan, or the ‘‘Plan,’’ currently has a target asset allocation of 70% equity and 30% fixed income.
The equity portion of the Plan is invested in one passively managed S&P 500 index fund, one passively
managed U.S. small/midcap fund and one actively managed international portfolio. The fixed income
portion of the Plan is actively managed by a professional investment manager and is benchmarked to
the Barclays Long Govt/Credit Index. The Plan assumes an 8.5% rate of return on assets, which
represents the expected long-term annual weighted-average return for the Plan in total.
The U.K. Plan currently invests in a professionally managed Balanced Consensus Index Fund, which has
the investment objective of achieving a total return relatively equal to its benchmark. The benchmark is
based upon the average asset weightings of a broad universe of U.K. pension funds invested in pooled
investment vehicles and each of their relevant indices. The asset allocation as of December 31, 2009,
was 83% equity, 8% fixed income and 9% cash. The U.K. Plan currently assumes a rate of return on
assets of 7.5%, which represents the expected long-term annual weighted-average return.
The FASB establishes a three-level valuation hierarchy based upon observable and non-observable
inputs. The hierarchy gives the highest priority to unadjusted quoted prices in active markets for identical
assets or liabilities (level 1 measurements) and the lowest priority to unobserved inputs (level 3
measurements). Observable inputs reflect market data obtained from independent sources, while
unobservable inputs reflect the Plan’s market assumptions. The three levels of the fair value hierarchy
are described as follows:
•Level 1 Inputs to the valuation methodology are unadjusted quoted prices for identical assets or
liabilities in active markets.
• Level 2 Inputs to the valuation methodology include:
• Quoted prices for similar assets or liabilities in active markets;
• Quoted prices for identical or similar assets or liabilities in inactive markets;
• Inputs other than quoted prices that are observable for the asset or liability;
130