Hertz 2009 Annual Report Download - page 79
Download and view the complete annual report
Please find page 79 of the 2009 Hertz annual report below. You can navigate through the pages in the report by either clicking on the pages listed below, or by using the keyword search tool below to find specific information within the annual report.-
 1
1 -
2
-
3
-
4
-
5
-
6
-
7
-
8
-
9
-
10
-
11
-
12
-
13
-
14
-
15
-
16
-
17
-
18
-
19
-
20
-
21
-
22
-
23
-
24
-
25
-
26
-
27
-
28
-
29
-
30
-
31
-
32
-
33
-
34
-
35
-
36
-
37
-
38
-
39
-
40
-
41
-
42
-
43
-
44
-
45
-
46
-
47
-
48
-
49
-
50
-
51
-
52
-
53
-
54
-
55
-
56
-
57
-
58
-
59
-
60
-
61
-
62
-
63
-
64
-
65
-
66
-
67
-
68
-
 69
69 -
 70
70 -
 71
71 -
 72
72 -
 73
73 -
 74
74 -
 75
75 -
 76
76 -
 77
77 -
 78
78 -
 79
79 -
 80
80 -
 81
81 -
 82
82 -
 83
83 -
 84
84 -
 85
85 -
 86
86 -
 87
87 -
 88
88 -
 89
89 -
90
-
91
-
92
-
93
-
94
-
95
-
96
-
97
-
98
-
99
-
100
-
101
-
102
-
103
-
104
-
105
-
106
-
107
-
108
-
109
-
110
-
111
-
112
-
113
-
114
-
115
-
116
-
117
-
118
-
119
-
120
-
121
-
122
-
123
-
124
-
125
-
126
-
127
-
128
-
129
-
130
-
131
-
132
-
133
-
134
-
135
-
136
-
137
-
138
-
139
-
140
-
141
-
142
-
143
-
144
-
145
-
146
-
147
-
148
-
149
-
150
-
151
-
152
-
153
-
154
-
155
-
156
-
157
-
158
-
159
-
160
-
161
-
162
-
163
-
164
-
165
-
166
-
167
-
168
-
169
-
170
-
171
-
172
-
173
-
174
-
175
-
176
-
177
-
178
-
179
-
180
-
181
-
182
-
183
-
184
-
185
-
186
-
187
-
188
-
189
-
190
-
191
-
192
-
193
-
194
-
195
-
196
-
197
-
198
-
199
-
200
-
201
-
202
-
203
-
204
-
205
-
206
-
207
-
208
-
209
-
210
-
211
-
212
-
213
-
214
-
215
-
216
-
217
-
218
-
219
-
220
-
221
-
222
-
223
-
224
-
225
-
226
-
227
-
228
-
229
-
230
-
231
-
232
 |
 |
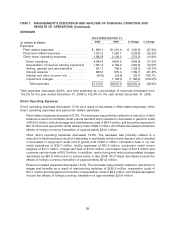
ITEM 7. MANAGEMENT’S DISCUSSION AND ANALYSIS OF FINANCIAL CONDITION AND
RESULTS OF OPERATIONS (Continued)
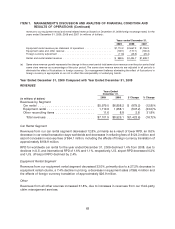
For the year ended December 31, 2009, based on publicly available information, we believe some U.S.
car rental companies experienced declines in transaction days and varying rental rate revenue per
transaction day, or ‘‘RPD,’’ compared to the year ended December 31, 2008. For the year ended
December 31, 2009, in the United States, we experienced a 7.1% decrease in transaction days and a
1.6% decrease in RPD versus 2008. During the year ended December 31, 2009, in our European
operations, we experienced a low double digit decrease in transaction days and a low single digit
decrease in RPD versus 2008.
In the three years ended December 31, 2009, we increased the number of our off-airport rental locations
in the United States by approximately 7% to approximately 1,700 locations. Revenues from our U.S.
off-airport operations represented $954.0 million, $975.9 million and $963.8 million of our total car rental
revenues in the years ended December 31, 2009, 2008 and 2007, respectively. In 2010 and subsequent
years, our strategy will include selected openings of new off-airport locations, the disciplined evaluation
of existing locations and the pursuit of same-store sales growth. Our strategy includes increasing
penetration in the off-airport market and growing the online leisure market, particularly in the longer
length weekly sector, which is characterized by lower vehicle costs and lower transaction costs at a
lower RPD. Increasing our penetration in these sectors is consistent with our long-term strategy to
generate profitable growth. When we open a new off-airport location, we incur a number of costs,
including those relating to site selection, lease negotiation, recruitment of employees, selection and
development of managers, initial sales activities and integration of our systems with those of the
companies who will reimburse the location’s replacement renters for their rentals. A new off-airport
location, once opened, takes time to generate its full potential revenues and, as a result, revenues at new
locations do not initially cover their start-up costs and often do not, for some time, cover the costs of their
ongoing operations.
For the years ended December 31, 2007, 2008 and 2009, based on publicly available information, we
believe the U.S. equipment rental industry experienced downward pricing. HERC experienced higher
equipment rental volumes and pricing worldwide for the year ended December 31, 2007, with pricing
increases in 2007 attributable to higher price activity in Canada and Europe offsetting lower price activity
in the U.S. HERC experienced lower equipment rental volumes and pricing worldwide for the years
ended December 31, 2008 and 2009.
Critical Accounting Policies and Estimates
Our discussion and analysis of financial condition and results of operations are based upon our
consolidated financial statements, which have been prepared in accordance with accounting principles
generally accepted in the United States of America, or ‘‘GAAP.’’ The preparation of these financial
statements requires management to make estimates and judgments that affect the reported amounts in
our financial statements and accompanying notes.
We believe the following critical accounting policies affect the more significant judgments and estimates
used in the preparation of our financial statements and changes in these judgments and estimates may
impact our future results of operations and financial condition. For additional discussion of our
accounting policies, see Note 1 to the Notes to our consolidated financial statements included in this
Annual Report under the caption ‘‘Item 8—Financial Statements and Supplementary Data.’’
Revenue Earning Equipment
Our principal assets are revenue earning equipment, which represented approximately 55% of our total
assets as of December 31, 2009. Revenue earning equipment consists of vehicles utilized in our car
59