Hertz 2009 Annual Report Download - page 173
Download and view the complete annual report
Please find page 173 of the 2009 Hertz annual report below. You can navigate through the pages in the report by either clicking on the pages listed below, or by using the keyword search tool below to find specific information within the annual report.-
 1
1 -
2
-
3
-
4
-
5
-
6
-
7
-
8
-
9
-
10
-
11
-
12
-
13
-
14
-
15
-
16
-
17
-
18
-
19
-
20
-
21
-
22
-
23
-
24
-
25
-
26
-
27
-
28
-
29
-
30
-
31
-
32
-
33
-
34
-
35
-
36
-
37
-
38
-
39
-
40
-
41
-
42
-
43
-
44
-
45
-
46
-
47
-
48
-
49
-
50
-
51
-
52
-
53
-
54
-
55
-
56
-
57
-
58
-
59
-
60
-
61
-
62
-
63
-
64
-
65
-
66
-
67
-
68
-
69
-
70
-
71
-
72
-
73
-
74
-
75
-
76
-
77
-
78
-
79
-
80
-
81
-
82
-
83
-
84
-
85
-
86
-
87
-
88
-
89
-
90
-
91
-
92
-
93
-
94
-
95
-
96
-
97
-
98
-
99
-
100
-
101
-
102
-
103
-
104
-
105
-
106
-
107
-
108
-
109
-
110
-
111
-
112
-
113
-
114
-
115
-
116
-
117
-
118
-
119
-
120
-
121
-
122
-
123
-
124
-
125
-
126
-
127
-
128
-
129
-
130
-
131
-
132
-
133
-
134
-
135
-
136
-
137
-
138
-
139
-
140
-
141
-
142
-
143
-
144
-
145
-
146
-
147
-
148
-
149
-
150
-
151
-
152
-
153
-
154
-
155
-
156
-
157
-
158
-
159
-
160
-
161
-
162
-
 163
163 -
 164
164 -
 165
165 -
 166
166 -
 167
167 -
 168
168 -
 169
169 -
 170
170 -
 171
171 -
 172
172 -
 173
173 -
 174
174 -
 175
175 -
 176
176 -
 177
177 -
 178
178 -
 179
179 -
 180
180 -
 181
181 -
 182
182 -
 183
183 -
184
-
185
-
186
-
187
-
188
-
189
-
190
-
191
-
192
-
193
-
194
-
195
-
196
-
197
-
198
-
199
-
200
-
201
-
202
-
203
-
204
-
205
-
206
-
207
-
208
-
209
-
210
-
211
-
212
-
213
-
214
-
215
-
216
-
217
-
218
-
219
-
220
-
221
-
222
-
223
-
224
-
225
-
226
-
227
-
228
-
229
-
230
-
231
-
232
 |
 |
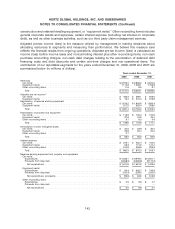
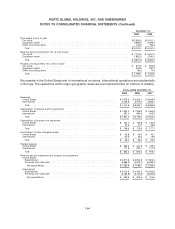
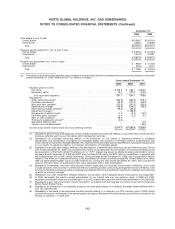
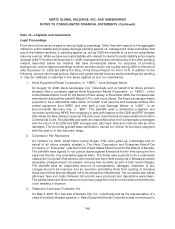
HERTZ GLOBAL HOLDINGS, INC. AND SUBSIDIARIES
NOTES TO CONSOLIDATED FINANCIAL STATEMENTS (Continued)
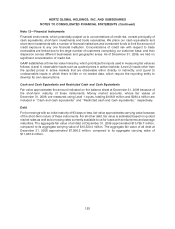
Note 12—Financial Instruments
Financial instruments, which potentially subject us to concentrations of credit risk, consist principally of
cash equivalents, short-term investments and trade receivables. We place our cash equivalents and
short-term investments with a number of financial institutions and investment funds to limit the amount of
credit exposure to any one financial institution. Concentrations of credit risk with respect to trade
receivables are limited due to the large number of customers comprising our customer base, and their
dispersion across different businesses and geographic areas. As of December 31, 2009, we had no
significant concentration of credit risk.
GAAP establishes a three-tier value hierarchy, which prioritizes the inputs used in measuring fair value as
follows: (Level 1) observable inputs such as quoted prices in active markets; (Level 2) inputs other than
the quoted prices in active markets that are observable either directly or indirectly; and (Level 3)
unobservable inputs in which there is little or no market data, which require the reporting entity to
develop its own assumptions.
Cash and Cash Equivalents and Restricted Cash and Cash Equivalents
Fair value approximates the amount indicated on the balance sheet at December 31, 2009 because of
the short-term maturity of these instruments. Money market accounts, whose fair values at
December 31, 2009, are measured using Level 1 inputs, totaling $106.8 million and $294.4 million are
included in ‘‘Cash and cash equivalents’’ and ‘‘Restricted cash and cash equivalents,’’ respectively.
Debt
For borrowings with an initial maturity of 93 days or less, fair value approximates carrying value because
of the short-term nature of these instruments. For all other debt, fair value is estimated based on quoted
market rates as well as borrowing rates currently available to us for loans with similar terms and average
maturities. The aggregate fair value of all debt at December 31, 2009 approximated $10,795.7 million,
compared to its aggregate carrying value of $10,530.4 million. The aggregate fair value of all debt at
December 31, 2008 approximated $7,968.3 million, compared to its aggregate carrying value of
$11,033.9 million.
153