Hertz 2009 Annual Report Download - page 183
Download and view the complete annual report
Please find page 183 of the 2009 Hertz annual report below. You can navigate through the pages in the report by either clicking on the pages listed below, or by using the keyword search tool below to find specific information within the annual report.-
 1
1 -
2
-
3
-
4
-
5
-
6
-
7
-
8
-
9
-
10
-
11
-
12
-
13
-
14
-
15
-
16
-
17
-
18
-
19
-
20
-
21
-
22
-
23
-
24
-
25
-
26
-
27
-
28
-
29
-
30
-
31
-
32
-
33
-
34
-
35
-
36
-
37
-
38
-
39
-
40
-
41
-
42
-
43
-
44
-
45
-
46
-
47
-
48
-
49
-
50
-
51
-
52
-
53
-
54
-
55
-
56
-
57
-
58
-
59
-
60
-
61
-
62
-
63
-
64
-
65
-
66
-
67
-
68
-
69
-
70
-
71
-
72
-
73
-
74
-
75
-
76
-
77
-
78
-
79
-
80
-
81
-
82
-
83
-
84
-
85
-
86
-
87
-
88
-
89
-
90
-
91
-
92
-
93
-
94
-
95
-
96
-
97
-
98
-
99
-
100
-
101
-
102
-
103
-
104
-
105
-
106
-
107
-
108
-
109
-
110
-
111
-
112
-
113
-
114
-
115
-
116
-
117
-
118
-
119
-
120
-
121
-
122
-
123
-
124
-
125
-
126
-
127
-
128
-
129
-
130
-
131
-
132
-
133
-
134
-
135
-
136
-
137
-
138
-
139
-
140
-
141
-
142
-
143
-
144
-
145
-
146
-
147
-
148
-
149
-
150
-
151
-
152
-
153
-
154
-
155
-
156
-
157
-
158
-
159
-
160
-
161
-
162
-
163
-
164
-
165
-
166
-
167
-
168
-
169
-
170
-
171
-
172
-
 173
173 -
 174
174 -
 175
175 -
 176
176 -
 177
177 -
 178
178 -
 179
179 -
 180
180 -
 181
181 -
 182
182 -
 183
183 -
 184
184 -
 185
185 -
 186
186 -
 187
187 -
 188
188 -
 189
189 -
 190
190 -
 191
191 -
 192
192 -
 193
193 -
194
-
195
-
196
-
197
-
198
-
199
-
200
-
201
-
202
-
203
-
204
-
205
-
206
-
207
-
208
-
209
-
210
-
211
-
212
-
213
-
214
-
215
-
216
-
217
-
218
-
219
-
220
-
221
-
222
-
223
-
224
-
225
-
226
-
227
-
228
-
229
-
230
-
231
-
232
 |
 |

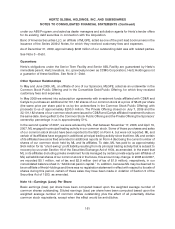
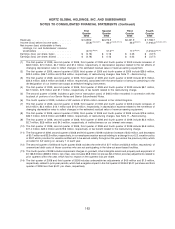
HERTZ GLOBAL HOLDINGS, INC. AND SUBSIDIARIES
NOTES TO CONSOLIDATED FINANCIAL STATEMENTS (Continued)
First Second Third Fourth
Quarter Quarter Quarter Quarter
2008 2008 2008 2008
Revenues ........................ $2,039.2 $2,275.3 $2,421.9 $ 1,788.7
Income (loss) before income taxes ........ (55.8)(7)(8)(9)(11) 93.0(7)(8)(9)(11)(12) 26.2(8)(9)(11) (1,446.2)(7)(8)(9)(12)(13)
Net income (loss) attributable to Hertz
Holdings, Inc. and Subsidiaries’ common
stockholders .................... (57.7)(10)(14) 51.2(10) 17.7(10)(14) (1,218.0)(10)(13)
Earnings (loss) per share, basic .......... $ (0.18) $ 0.16 $ 0.05 $ (3.77)
Earnings (loss) per share, diluted ......... $ (0.18) $ 0.16 $ 0.05 $ (3.77)
(1) The first quarter of 2009, second quarter of 2009, third quarter of 2009 and fourth quarter of 2009 include increases of
$6.6 million, $7.0 million, $4.7 million and $1.0 million, respectively, in depreciation expense related to the net effects of
changing depreciation rates to reflect changes in the estimated residual value of revenue earning equipment.
(2) The first quarter of 2009, second quarter of 2009, third quarter of 2009 and fourth quarter of 2009 include $29.5 million,
$22.0 million, $35.7 million and $19.6 million, respectively, of restructuring charges. See Note 11—Restructuring.
(3) The first quarter of 2009, second quarter of 2009, third quarter of 2009 and fourth quarter of 2009 include $7.5 million,
$22.3 million, $22.4 million and $22.4 million, respectively, associated with the amortization of amounts pertaining to the
de-designation of our interest rate swaps as effective hedging instruments.
(4) The first quarter of 2009, second quarter of 2009, third quarter of 2009 and fourth quarter of 2009 include $8.1 million,
$2.7 million, $7.5 million and $1.7 million, respectively, of tax benefit related to the restructuring charge.
(5) The second quarter of 2009, includes a gain (net of transaction costs) of $48.5 million recorded in connection with the
buyback of portions of our Senior Notes and Senior Subordinated Notes.
(6) The fourth quarter of 2009, includes a VAT reclaim of $18.5 million received in the United Kingdom.
(7) The first quarter of 2008, second quarter of 2008, third quarter of 2008 and fourth quarter of 2008 include increases of
$4.2 million, $2.2 million, $12.1 million and $14.2 million, respectively, in depreciation expense related to the net effects of
changing depreciation rates to reflect changes in the estimated residual value of revenue earning equipment.
(8) The first quarter of 2008, second quarter of 2008, third quarter of 2008 and fourth quarter of 2008 include $19.6 million,
$32.7 million, $74.9 million and $88.9 million, respectively, of restructuring charges. See Note 11—Restructuring.
(9) The first quarter of 2008, second quarter of 2008, third quarter of 2008 and fourth quarter of 2008 include $2.3 million,
$2.7 million, $2.8 million and $4.0 million, respectively, of ineffectiveness on our interest rate swaps.
(10) The first quarter of 2008, second quarter of 2008, third quarter of 2008 and fourth quarter of 2008 include $5.8 million,
$11.4 million, $23.0 million and $19.6 million, respectively, of tax benefit related to the restructuring charge.
(11) The first quarter of 2008, second quarter of 2008 and third quarter of 2008 include an increase of $3.2 million, and decreases
of $0.7 million and $2.5 million, respectively, in our employee vacation accrual relating to a change in our U.S. vacation policy
in 2007 which provides for vacation entitlement to be earned ratably throughout the year versus the previous policy which
provided for full vesting on January 1 of each year.
(12) The second quarter of 2008 and fourth quarter 2008 includes the write-off of $7.7 million and $22.3 million, respectively, of
unamortized debt costs of those countries who are not participating in the take-out asset-based facilities.
(13) The fourth quarter of 2008 includes impairment charges on goodwill, other intangible assets and property and equipment of
$1,168.9 million ($989.0 million, net of tax). Also includes $3.8 million of pre-tax ($2.4 million post-tax) adjustments related to
prior quarters within the year, which had no impact on the quarters loss per share.
(14) The first quarter of 2008 and third quarter of 2008 includes unfavorable tax adjustments of $4.3 million and $1.3 million,
respectively, related to prior year periods, which had a negative impact in the first quarter of 2008 of $0.01 per share and third
quarter of 2008 less than $0.01 per share, respectively.
163