Hertz 2009 Annual Report Download - page 74
Download and view the complete annual report
Please find page 74 of the 2009 Hertz annual report below. You can navigate through the pages in the report by either clicking on the pages listed below, or by using the keyword search tool below to find specific information within the annual report.-
 1
1 -
2
-
3
-
4
-
5
-
6
-
7
-
8
-
9
-
10
-
11
-
12
-
13
-
14
-
15
-
16
-
17
-
18
-
19
-
20
-
21
-
22
-
23
-
24
-
25
-
26
-
27
-
28
-
29
-
30
-
31
-
32
-
33
-
34
-
35
-
36
-
37
-
38
-
39
-
40
-
41
-
42
-
43
-
44
-
45
-
46
-
47
-
48
-
49
-
50
-
51
-
52
-
53
-
54
-
55
-
56
-
57
-
58
-
59
-
60
-
61
-
62
-
63
-
 64
64 -
 65
65 -
 66
66 -
 67
67 -
 68
68 -
 69
69 -
 70
70 -
 71
71 -
 72
72 -
 73
73 -
 74
74 -
 75
75 -
 76
76 -
 77
77 -
 78
78 -
 79
79 -
 80
80 -
 81
81 -
 82
82 -
 83
83 -
 84
84 -
85
-
86
-
87
-
88
-
89
-
90
-
91
-
92
-
93
-
94
-
95
-
96
-
97
-
98
-
99
-
100
-
101
-
102
-
103
-
104
-
105
-
106
-
107
-
108
-
109
-
110
-
111
-
112
-
113
-
114
-
115
-
116
-
117
-
118
-
119
-
120
-
121
-
122
-
123
-
124
-
125
-
126
-
127
-
128
-
129
-
130
-
131
-
132
-
133
-
134
-
135
-
136
-
137
-
138
-
139
-
140
-
141
-
142
-
143
-
144
-
145
-
146
-
147
-
148
-
149
-
150
-
151
-
152
-
153
-
154
-
155
-
156
-
157
-
158
-
159
-
160
-
161
-
162
-
163
-
164
-
165
-
166
-
167
-
168
-
169
-
170
-
171
-
172
-
173
-
174
-
175
-
176
-
177
-
178
-
179
-
180
-
181
-
182
-
183
-
184
-
185
-
186
-
187
-
188
-
189
-
190
-
191
-
192
-
193
-
194
-
195
-
196
-
197
-
198
-
199
-
200
-
201
-
202
-
203
-
204
-
205
-
206
-
207
-
208
-
209
-
210
-
211
-
212
-
213
-
214
-
215
-
216
-
217
-
218
-
219
-
220
-
221
-
222
-
223
-
224
-
225
-
226
-
227
-
228
-
229
-
230
-
231
-
232
 |
 |
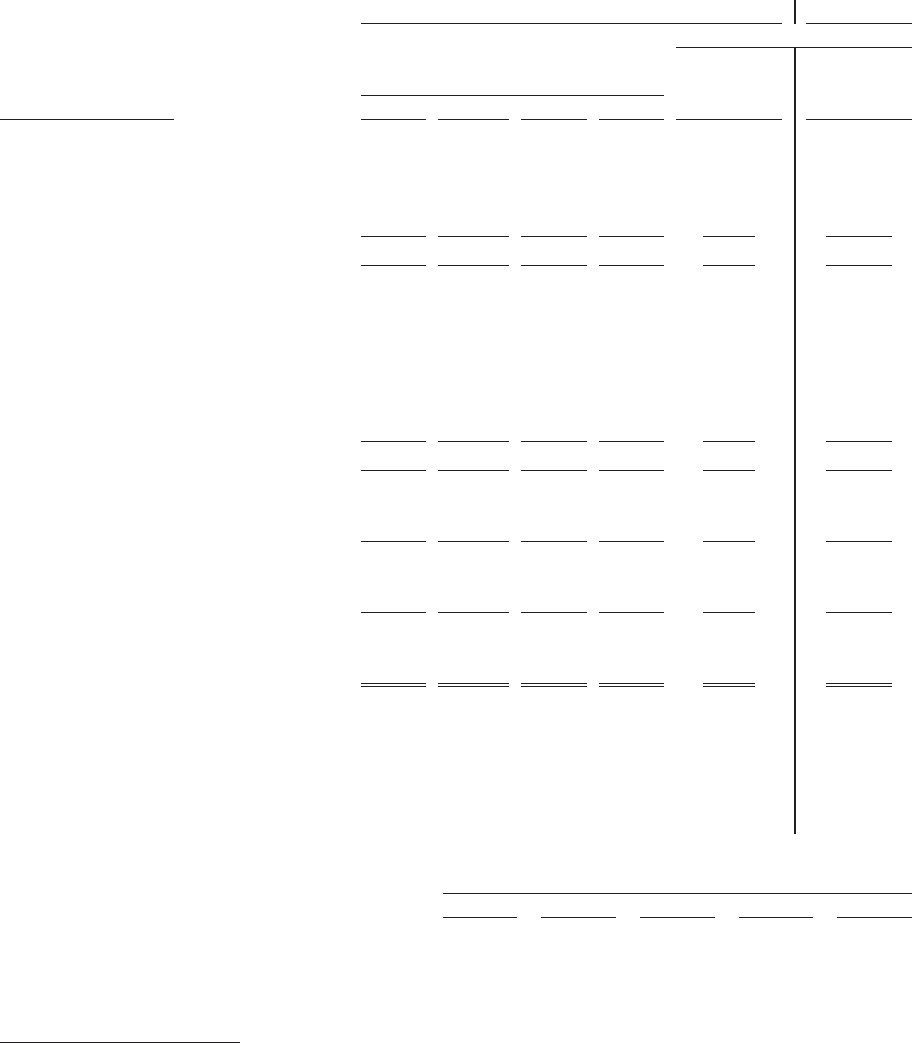
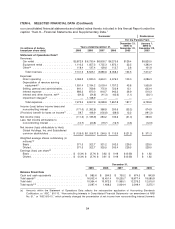
ITEM 6. SELECTED FINANCIAL DATA (Continued)
our consolidated financial statements and related notes thereto included in this Annual Report under the
caption ‘‘Item 8—Financial Statements and Supplementary Data.’’
Successor Predecessor
For the Periods From
December 21, January 1,
2005 to 2005 to
Years ended December 31,
(In millions of dollars, December 31, December 20,
except per share data) 2009 2008 2007 2006 2005 2005
Statement of Operations Data(a)
Revenues:
Car rental ...................... $5,872.9 $ 6,730.4 $6,800.7 $6,273.6 $129.4 $5,820.5
Equipment rental ................. 1,110.2 1,657.3 1,755.3 1,672.1 22.5 1,392.4
Other(b) ....................... 118.4 137.4 129.6 112.7 2.6 101.8
Total revenues ................. 7,101.5 8,525.1 8,685.6 8,058.4 154.5 7,314.7
Expenses:
Direct operating .................. 4,084.2 4,930.0 4,644.1 4,476.0 103.0 4,086.3
Depreciation of revenue earning
equipment(c) ................... 1,931.4 2,194.2 2,003.4 1,757.2 43.8 1,555.9
Selling, general and administrative ...... 641.1 769.6 775.9 723.9 15.1 623.4
Interest expense ................. 680.3 870.0 916.7 943.3 26.9 510.3
Interest and other income, net(d) ....... (64.5) (24.8) (41.3) (42.6) (1.1) (36.1)
Impairment charges(e) .............. — 1,168.9 —— — —
Total expenses ................. 7,272.5 9,907.9 8,298.8 7,857.8 187.7 6,739.8
Income (loss) before income taxes and
noncontrolling interest .............. (171.0) (1,382.8) 386.8 200.6 (33.2) 574.9
(Provision) benefit for taxes on income(f) . . . 59.7 196.9 (102.6) (68.0) 12.2 (191.3)
Net income (loss) .................. (111.3) (1,185.9) 284.2 132.6 (21.0) 383.6
Less: Net income attributable to
noncontrolling interest .............. (14.7) (20.8) (19.7) (16.7) (0.3) (12.3)
Net income (loss) attributable to Hertz
Global Holdings, Inc. and Subsidiaries’
common stockholders .............. $(126.0) $(1,206.7) $ 264.5 $ 115.9 $ (21.3) $ 371.3
Weighted average shares outstanding (in
millions)(g)
Basic ......................... 371.5 322.7 321.2 242.5 229.5 229.5
Diluted ........................ 371.5 322.7 325.5 243.4 229.5 229.5
Earnings (loss) per share(g)
Basic ......................... $ (0.34) $ (3.74) $ 0.82 $ 0.48 $ (0.09) $ 1.62
Diluted ........................ $ (0.34) $ (3.74) $ 0.81 $ 0.48 $ (0.09) $ 1.62
December 31,
2009 2008 2007 2006 2005
Balance Sheet Data
Cash and cash equivalents .................. $ 985.6 $ 594.3 $ 730.2 $ 674.5 $ 843.9
Total assets(h) ........................... 16,002.4 16,451.4 19,255.7 18,677.4 18,580.9
Total debt ............................. 10,364.4 10,972.3 11,960.1 12,276.2 12,515.0
Total equity(i)(j) ........................... 2,097.4 1,488.3 2,934.4 2,549.4 2,275.1
(a) Amounts within the Statement of Operations Data reflects the retrospective application of Accounting Standards
Codification, or ‘‘ASC,’’ 810-10, ‘‘Noncontrolling Interests in Consolidated Financial Statements—an amendment of ARB
No. 51,’’ or ‘‘ASC 810-10,’’ which primarily changed the presentation of net income from noncontrolling interest (formerly
54