HSBC 2006 Annual Report Download - page 98
Download and view the complete annual report
Please find page 98 of the 2006 HSBC annual report below. You can navigate through the pages in the report by either clicking on the pages listed below, or by using the keyword search tool below to find specific information within the annual report.-
 1
1 -
2
-
3
-
4
-
5
-
6
-
7
-
8
-
9
-
10
-
11
-
12
-
13
-
14
-
15
-
16
-
17
-
18
-
19
-
20
-
21
-
22
-
23
-
24
-
25
-
26
-
27
-
28
-
29
-
30
-
31
-
32
-
33
-
34
-
35
-
36
-
37
-
38
-
39
-
40
-
41
-
42
-
43
-
44
-
45
-
46
-
47
-
48
-
49
-
50
-
51
-
52
-
53
-
54
-
55
-
56
-
57
-
58
-
59
-
60
-
61
-
62
-
63
-
64
-
65
-
66
-
67
-
68
-
69
-
70
-
71
-
72
-
73
-
74
-
75
-
76
-
77
-
78
-
79
-
80
-
81
-
82
-
83
-
84
-
85
-
86
-
87
-
 88
88 -
 89
89 -
 90
90 -
 91
91 -
 92
92 -
 93
93 -
 94
94 -
 95
95 -
 96
96 -
 97
97 -
 98
98 -
 99
99 -
 100
100 -
 101
101 -
 102
102 -
 103
103 -
 104
104 -
 105
105 -
 106
106 -
 107
107 -
 108
108 -
109
-
110
-
111
-
112
-
113
-
114
-
115
-
116
-
117
-
118
-
119
-
120
-
121
-
122
-
123
-
124
-
125
-
126
-
127
-
128
-
129
-
130
-
131
-
132
-
133
-
134
-
135
-
136
-
137
-
138
-
139
-
140
-
141
-
142
-
143
-
144
-
145
-
146
-
147
-
148
-
149
-
150
-
151
-
152
-
153
-
154
-
155
-
156
-
157
-
158
-
159
-
160
-
161
-
162
-
163
-
164
-
165
-
166
-
167
-
168
-
169
-
170
-
171
-
172
-
173
-
174
-
175
-
176
-
177
-
178
-
179
-
180
-
181
-
182
-
183
-
184
-
185
-
186
-
187
-
188
-
189
-
190
-
191
-
192
-
193
-
194
-
195
-
196
-
197
-
198
-
199
-
200
-
201
-
202
-
203
-
204
-
205
-
206
-
207
-
208
-
209
-
210
-
211
-
212
-
213
-
214
-
215
-
216
-
217
-
218
-
219
-
220
-
221
-
222
-
223
-
224
-
225
-
226
-
227
-
228
-
229
-
230
-
231
-
232
-
233
-
234
-
235
-
236
-
237
-
238
-
239
-
240
-
241
-
242
-
243
-
244
-
245
-
246
-
247
-
248
-
249
-
250
-
251
-
252
-
253
-
254
-
255
-
256
-
257
-
258
-
259
-
260
-
261
-
262
-
263
-
264
-
265
-
266
-
267
-
268
-
269
-
270
-
271
-
272
-
273
-
274
-
275
-
276
-
277
-
278
-
279
-
280
-
281
-
282
-
283
-
284
-
285
-
286
-
287
-
288
-
289
-
290
-
291
-
292
-
293
-
294
-
295
-
296
-
297
-
298
-
299
-
300
-
301
-
302
-
303
-
304
-
305
-
306
-
307
-
308
-
309
-
310
-
311
-
312
-
313
-
314
-
315
-
316
-
317
-
318
-
319
-
320
-
321
-
322
-
323
-
324
-
325
-
326
-
327
-
328
-
329
-
330
-
331
-
332
-
333
-
334
-
335
-
336
-
337
-
338
-
339
-
340
-
341
-
342
-
343
-
344
-
345
-
346
-
347
-
348
-
349
-
350
-
351
-
352
-
353
-
354
-
355
-
356
-
357
-
358
-
359
-
360
-
361
-
362
-
363
-
364
-
365
-
366
-
367
-
368
-
369
-
370
-
371
-
372
-
373
-
374
-
375
-
376
-
377
-
378
-
379
-
380
-
381
-
382
-
383
-
384
-
385
-
386
-
387
-
388
-
389
-
390
-
391
-
392
-
393
-
394
-
395
-
396
-
397
-
398
-
399
-
400
-
401
-
402
-
403
-
404
-
405
-
406
-
407
-
408
-
409
-
410
-
411
-
412
-
413
-
414
-
415
-
416
-
417
-
418
-
419
-
420
-
421
-
422
-
423
-
424
-
425
-
426
-
427
-
428
-
429
-
430
-
431
-
432
-
433
-
434
-
435
-
436
-
437
-
438
-
439
-
440
-
441
-
442
-
443
-
444
-
445
-
446
-
447
-
448
-
449
-
450
-
451
-
452
-
453
-
454
-
455
-
456
-
457
-
458
 |
 |

HSBC HOLDINGS PLC
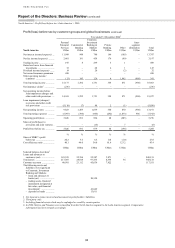
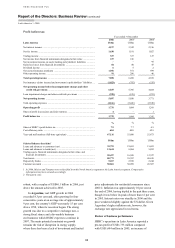
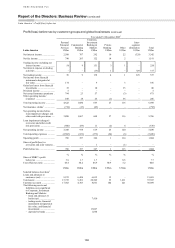
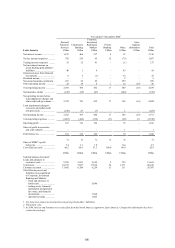
Report of the Directors: Business Review (continued)
Latin America > 2006 / 2005
96
primarily driven by small and middle market
customers. The recruitment of additional relationship
managers and sales staff, investments made in
receivables financing and greater levels of
promotional activity all combined to build HSBC’s
position in this market segment. There was ongoing
success from the ‘giro fácil’ product, offering both
revolving loan and overdraft facilities, with average
balances recording a 13 per cent increase. Spreads
widened as interest rates fell, further augmenting the
income benefits of higher lending volumes.
A 42 per cent rise in net interest income in
Argentina was primarily attributable to strong asset
and liability growth. Average lending and deposit
balances increased by 39 per cent and 19 per cent
respectively, as customer numbers rose, particularly
to the small and micro businesses, helped by
favourable economic conditions and investment in
new sales channels. Asset spreads declined, however,
due to competitive market pressures on pricing, partly
offsetting the income benefits of higher lending
volumes. By contrast, deposit spreads improved.
Net fee income was 36 per cent higher, driven by
robust increases across Mexico, Brazil and Argentina.
In Mexico, fee income rose by 28 per cent with
notable success in increasing cross-sales activity.
Growth in customer numbers contributed to higher
transactional volumes which, combined with an
expanded and improved product offering plus
increased marketing activity and re-pricing
initiatives, led to a 41 per cent rise in income from
payments and cash management services. The
‘Estimulo’ product offering, comprising a packaged
suite of seven different products including a loan
facility, continued to perform well with fee income
nearly trebling compared with 2005. During the third
quarter, a similar product, ‘Estimulo Empresarial’,
was launched, targeting upper-end small business
customers. This product encompasses a suite of
eleven different services and since its introduction
more than 165 clients have been signed, generating
US$50 million of new loans. HSBC’s share of the
trade services market continued to grow, building on
the Group’s international network and product
capabilities. Fees from international factoring and
domestic invoicing payment products also rose, as
new products were successfully piloted and marketed
to existing clients. The signing of new merchant
customers led to higher transaction volumes and a
subsequent 60 per cent rise in card acquiring fees.
In Brazil, fee income rose by 47 per cent as
effective cross-selling led to an increase in the
average number of products held per customer.
Current account fee income grew from higher levels
of transactional activity and tariff increases
implemented in 2005. Pricing changes introduced
part-way through 2006 led to higher revenues from
payment and cash management services. There was
improved fee income from assets under management,
and additional marketing to promote trade products
led to a rise in trade services fees.
Fee income in Argentina was 27 per cent higher,
primarily from increases in account and trade
services along with payments and cash management
fees.
Loan impairment charges and other credit risk
provisions doubled, reflecting strong lending growth,
a higher proportion of small and micro business
lending, and the seasoning of the portfolio.
In Mexico, strong growth in the lower-end small
and micro business lending balances led to increased
loan impairment charges during the year.
A 41 per cent rise in Brazil again reflected large
increases in small and micro business lending
balances and higher delinquency rates as the portfolio
seasoned. This led to a 12 basis point increase in the
proportion of impaired loans to assets. Various
actions were undertaken to manage the effects of the
weakening credit environment, with debt collection
operations enhanced and closer cooperation forged
between sales and collections staff. Changes were
also made to underwriting criteria, coupled with
revisions to sales staff incentive schemes. Following
these measures, an improvement in credit quality was
seen and charges reduced in the second half of the
year compared with the first half. In Argentina,
releases were lower than in 2005.
Operating expenses of US$822 million were
21 per cent higher than in 2005, as businesses
expanded strongly across Latin America.
In Mexico, operating expenses rose by 26 per
cent, largely driven by higher transactional volumes,
new clients acquired and increased lending activity.
Non-staff costs were higher, reflecting the marketing
and IT-related support to business growth.
In Brazil, expenses grew by 19 per cent,
also largely from higher staff, marketing and
administrative costs. Business expansion activities in
the small and middle market customer segments
followed the recruitment of 270 additional employees
and this, together with union-agreed pay increases,
were the principal drivers behind the 21 per cent rise
in staff costs. Continued enlargement of the branch
network, the opening of an International Banking
Centre and new sales offices combined with increases
in marketing and administration costs in support of
business expansion, contributed further to cost