HSBC 2006 Annual Report Download - page 242
Download and view the complete annual report
Please find page 242 of the 2006 HSBC annual report below. You can navigate through the pages in the report by either clicking on the pages listed below, or by using the keyword search tool below to find specific information within the annual report.-
 1
1 -
2
-
3
-
4
-
5
-
6
-
7
-
8
-
9
-
10
-
11
-
12
-
13
-
14
-
15
-
16
-
17
-
18
-
19
-
20
-
21
-
22
-
23
-
24
-
25
-
26
-
27
-
28
-
29
-
30
-
31
-
32
-
33
-
34
-
35
-
36
-
37
-
38
-
39
-
40
-
41
-
42
-
43
-
44
-
45
-
46
-
47
-
48
-
49
-
50
-
51
-
52
-
53
-
54
-
55
-
56
-
57
-
58
-
59
-
60
-
61
-
62
-
63
-
64
-
65
-
66
-
67
-
68
-
69
-
70
-
71
-
72
-
73
-
74
-
75
-
76
-
77
-
78
-
79
-
80
-
81
-
82
-
83
-
84
-
85
-
86
-
87
-
88
-
89
-
90
-
91
-
92
-
93
-
94
-
95
-
96
-
97
-
98
-
99
-
100
-
101
-
102
-
103
-
104
-
105
-
106
-
107
-
108
-
109
-
110
-
111
-
112
-
113
-
114
-
115
-
116
-
117
-
118
-
119
-
120
-
121
-
122
-
123
-
124
-
125
-
126
-
127
-
128
-
129
-
130
-
131
-
132
-
133
-
134
-
135
-
136
-
137
-
138
-
139
-
140
-
141
-
142
-
143
-
144
-
145
-
146
-
147
-
148
-
149
-
150
-
151
-
152
-
153
-
154
-
155
-
156
-
157
-
158
-
159
-
160
-
161
-
162
-
163
-
164
-
165
-
166
-
167
-
168
-
169
-
170
-
171
-
172
-
173
-
174
-
175
-
176
-
177
-
178
-
179
-
180
-
181
-
182
-
183
-
184
-
185
-
186
-
187
-
188
-
189
-
190
-
191
-
192
-
193
-
194
-
195
-
196
-
197
-
198
-
199
-
200
-
201
-
202
-
203
-
204
-
205
-
206
-
207
-
208
-
209
-
210
-
211
-
212
-
213
-
214
-
215
-
216
-
217
-
218
-
219
-
220
-
221
-
222
-
223
-
224
-
225
-
226
-
227
-
228
-
229
-
230
-
231
-
 232
232 -
 233
233 -
 234
234 -
 235
235 -
 236
236 -
 237
237 -
 238
238 -
 239
239 -
 240
240 -
 241
241 -
 242
242 -
 243
243 -
 244
244 -
 245
245 -
 246
246 -
 247
247 -
 248
248 -
 249
249 -
 250
250 -
 251
251 -
 252
252 -
253
-
254
-
255
-
256
-
257
-
258
-
259
-
260
-
261
-
262
-
263
-
264
-
265
-
266
-
267
-
268
-
269
-
270
-
271
-
272
-
273
-
274
-
275
-
276
-
277
-
278
-
279
-
280
-
281
-
282
-
283
-
284
-
285
-
286
-
287
-
288
-
289
-
290
-
291
-
292
-
293
-
294
-
295
-
296
-
297
-
298
-
299
-
300
-
301
-
302
-
303
-
304
-
305
-
306
-
307
-
308
-
309
-
310
-
311
-
312
-
313
-
314
-
315
-
316
-
317
-
318
-
319
-
320
-
321
-
322
-
323
-
324
-
325
-
326
-
327
-
328
-
329
-
330
-
331
-
332
-
333
-
334
-
335
-
336
-
337
-
338
-
339
-
340
-
341
-
342
-
343
-
344
-
345
-
346
-
347
-
348
-
349
-
350
-
351
-
352
-
353
-
354
-
355
-
356
-
357
-
358
-
359
-
360
-
361
-
362
-
363
-
364
-
365
-
366
-
367
-
368
-
369
-
370
-
371
-
372
-
373
-
374
-
375
-
376
-
377
-
378
-
379
-
380
-
381
-
382
-
383
-
384
-
385
-
386
-
387
-
388
-
389
-
390
-
391
-
392
-
393
-
394
-
395
-
396
-
397
-
398
-
399
-
400
-
401
-
402
-
403
-
404
-
405
-
406
-
407
-
408
-
409
-
410
-
411
-
412
-
413
-
414
-
415
-
416
-
417
-
418
-
419
-
420
-
421
-
422
-
423
-
424
-
425
-
426
-
427
-
428
-
429
-
430
-
431
-
432
-
433
-
434
-
435
-
436
-
437
-
438
-
439
-
440
-
441
-
442
-
443
-
444
-
445
-
446
-
447
-
448
-
449
-
450
-
451
-
452
-
453
-
454
-
455
-
456
-
457
-
458
 |
 |

HSBC HOLDINGS PLC
Report of the Directors: The Management of Risk (continued)
Insurance operations > Credit risk / Liquidity risk / PVIF
240
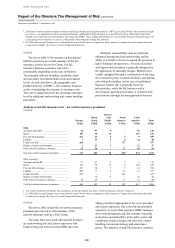
(Audited)
Reinsurers’ share of liabilities under
insurance contracts
Linked
insurance
contracts
Non-linked
insurance
contracts Total
Reinsurance
debtors
US$m US$m US$m US$m
At 31 December 2006
AAA .............................................................................. 10 106 116 –
AA– to AA .................................................................... 33 812 845 37
A– to A+ ....................................................................... – 586 586 5
Lower than A– .............................................................. 15 37 52 3
Unrated ......................................................................... – 170 170 3
Total1 ............................................................................. 58 1,711 1,769 48
At 31 December 2005
AAA .............................................................................. 7 61 68 –
AA– to AA .................................................................... 29 735 764 5
A– to A+ ....................................................................... 8 536 544 27
Lower than A– .............................................................. 25 68 93 2
Unrated ......................................................................... – 76 76 6
Total1 ............................................................................. 69 1,476 1,545 40
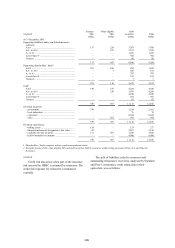
1 Excludes reinsurers’ share of liabilities under insurance contracts and reinsurance debtors of insurance underwriting associates Erisa,
S.A. and Ping An Insurance.
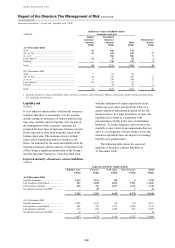
Liquidity risk
(Audited)
It is an inherent characteristic of almost all insurance
contracts that there is uncertainty over the amount
and the timing of settlement of claims liabilities that
may arise, and this leads to liquidity risk. As part of
the management of this exposure, estimates are
prepared for most lines of insurance business of cash
flows expected to arise from insurance funds at the
balance sheet date. The estimates always include
future renewal premiums and new business cash
flows. As indicated by the asset and liability table for
insurance business, and the analysis of insurance risk
of the Group, a significant proportion of the Group’s
non-life insurance business is viewed as short term,
with the settlement of claims expected to occur
within one year of the period of risk. There is a
greater spread of anticipated duration for the life
business where, in a large proportion of cases, the
liquidity risk is borne in conjunction with
policyholders (wholly in the case of unit-linked
business). To ensure adequate cash resources are
available to meet short-term requirements that can
arise as a consequence of large claims events, the
insurance operations have an objective to manage
liquidity on a prudent basis.
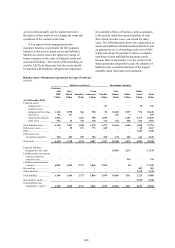
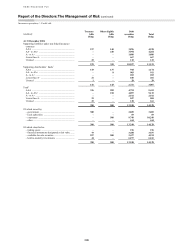
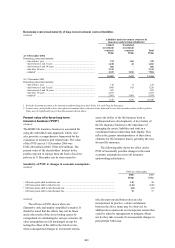
The following table shows the expected
maturity of insurance contract liabilities at
31 December 2006.
Expected maturity of insurance contract liabilities
(Audited)
Expected cash flows (undiscounted)
Within 1 year 1-5 years 5-15 years Over 15 years Total
US$m US$m US$m US$m US$m
At 31 December 2006
Non-life insurance .................................... 1,679 1,136 118 6 2,939
Life insurance (non-linked) ...................... 387 1,258 5,034 5,191 11,870
Life insurance (linked) ............................. 236 793 1,517 1,172 3,718
Investment contracts with DPF ................ – 20 – 1 21
2,302 3,207 6,669 6,370 18,548
At 31 December 2005
Non-life insurance .................................... 1,422 1,149 130 170 2,871
Life insurance (non-linked) ...................... 401 786 3,779 4,208 9,174
Life insurance (linked) ............................. 145 628 1,205 947 2,925
Investment contracts with DPF ................ (1) 11 – – 10
1,967 2,574 5,114 5,325 14,980