HSBC 2006 Annual Report Download - page 352
Download and view the complete annual report
Please find page 352 of the 2006 HSBC annual report below. You can navigate through the pages in the report by either clicking on the pages listed below, or by using the keyword search tool below to find specific information within the annual report.-
 1
1 -
2
-
3
-
4
-
5
-
6
-
7
-
8
-
9
-
10
-
11
-
12
-
13
-
14
-
15
-
16
-
17
-
18
-
19
-
20
-
21
-
22
-
23
-
24
-
25
-
26
-
27
-
28
-
29
-
30
-
31
-
32
-
33
-
34
-
35
-
36
-
37
-
38
-
39
-
40
-
41
-
42
-
43
-
44
-
45
-
46
-
47
-
48
-
49
-
50
-
51
-
52
-
53
-
54
-
55
-
56
-
57
-
58
-
59
-
60
-
61
-
62
-
63
-
64
-
65
-
66
-
67
-
68
-
69
-
70
-
71
-
72
-
73
-
74
-
75
-
76
-
77
-
78
-
79
-
80
-
81
-
82
-
83
-
84
-
85
-
86
-
87
-
88
-
89
-
90
-
91
-
92
-
93
-
94
-
95
-
96
-
97
-
98
-
99
-
100
-
101
-
102
-
103
-
104
-
105
-
106
-
107
-
108
-
109
-
110
-
111
-
112
-
113
-
114
-
115
-
116
-
117
-
118
-
119
-
120
-
121
-
122
-
123
-
124
-
125
-
126
-
127
-
128
-
129
-
130
-
131
-
132
-
133
-
134
-
135
-
136
-
137
-
138
-
139
-
140
-
141
-
142
-
143
-
144
-
145
-
146
-
147
-
148
-
149
-
150
-
151
-
152
-
153
-
154
-
155
-
156
-
157
-
158
-
159
-
160
-
161
-
162
-
163
-
164
-
165
-
166
-
167
-
168
-
169
-
170
-
171
-
172
-
173
-
174
-
175
-
176
-
177
-
178
-
179
-
180
-
181
-
182
-
183
-
184
-
185
-
186
-
187
-
188
-
189
-
190
-
191
-
192
-
193
-
194
-
195
-
196
-
197
-
198
-
199
-
200
-
201
-
202
-
203
-
204
-
205
-
206
-
207
-
208
-
209
-
210
-
211
-
212
-
213
-
214
-
215
-
216
-
217
-
218
-
219
-
220
-
221
-
222
-
223
-
224
-
225
-
226
-
227
-
228
-
229
-
230
-
231
-
232
-
233
-
234
-
235
-
236
-
237
-
238
-
239
-
240
-
241
-
242
-
243
-
244
-
245
-
246
-
247
-
248
-
249
-
250
-
251
-
252
-
253
-
254
-
255
-
256
-
257
-
258
-
259
-
260
-
261
-
262
-
263
-
264
-
265
-
266
-
267
-
268
-
269
-
270
-
271
-
272
-
273
-
274
-
275
-
276
-
277
-
278
-
279
-
280
-
281
-
282
-
283
-
284
-
285
-
286
-
287
-
288
-
289
-
290
-
291
-
292
-
293
-
294
-
295
-
296
-
297
-
298
-
299
-
300
-
301
-
302
-
303
-
304
-
305
-
306
-
307
-
308
-
309
-
310
-
311
-
312
-
313
-
314
-
315
-
316
-
317
-
318
-
319
-
320
-
321
-
322
-
323
-
324
-
325
-
326
-
327
-
328
-
329
-
330
-
331
-
332
-
333
-
334
-
335
-
336
-
337
-
338
-
339
-
340
-
341
-
 342
342 -
 343
343 -
 344
344 -
 345
345 -
 346
346 -
 347
347 -
 348
348 -
 349
349 -
 350
350 -
 351
351 -
 352
352 -
 353
353 -
 354
354 -
 355
355 -
 356
356 -
 357
357 -
 358
358 -
 359
359 -
 360
360 -
 361
361 -
 362
362 -
363
-
364
-
365
-
366
-
367
-
368
-
369
-
370
-
371
-
372
-
373
-
374
-
375
-
376
-
377
-
378
-
379
-
380
-
381
-
382
-
383
-
384
-
385
-
386
-
387
-
388
-
389
-
390
-
391
-
392
-
393
-
394
-
395
-
396
-
397
-
398
-
399
-
400
-
401
-
402
-
403
-
404
-
405
-
406
-
407
-
408
-
409
-
410
-
411
-
412
-
413
-
414
-
415
-
416
-
417
-
418
-
419
-
420
-
421
-
422
-
423
-
424
-
425
-
426
-
427
-
428
-
429
-
430
-
431
-
432
-
433
-
434
-
435
-
436
-
437
-
438
-
439
-
440
-
441
-
442
-
443
-
444
-
445
-
446
-
447
-
448
-
449
-
450
-
451
-
452
-
453
-
454
-
455
-
456
-
457
-
458
 |
 |

HSBC HOLDINGS PLC
Notes on the Financial Statements (continued)
Notes 15 and 16
350
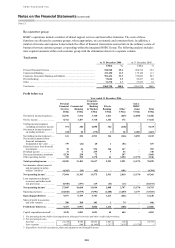
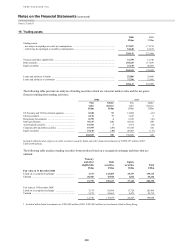
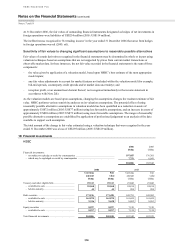
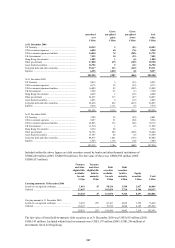
15 Trading assets
2006 2005
US$m US$m
Trading assets:
– not subject to repledge or resale by counterparties ........................................................................ 273,507 171,274
– which may be repledged or resold by counterparties ..................................................................... 54,640 61,635
328,147 232,909
Treasury and other eligible bills ........................................................................................................ 21,759 12,746
Debt securities ................................................................................................................................... 155,447 117,659
Equity securities ................................................................................................................................ 27,149 20,203
204,355 150,608
Loans and advances to banks ............................................................................................................ 52,006 29,806
Loans and advances to customers ..................................................................................................... 71,786 52,495
328,147 232,909
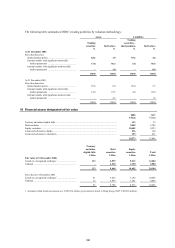
The following table provides an analysis of trading securities which are valued at market value and the net gains/
(losses) resulting from trading activities:
2006 2005
Fair
value
Gains/
(losses)
Fair
value
Gains/
(losses)
US$m US$m US$m US$m
US Treasury and US Government agencies ................. 8,348 91 12,094 (21)
UK Government ............................................................ 6,176 77 3,225 2
Hong Kong Government .............................................. 8,759 4 6,529 (16)
Other government ......................................................... 70,747 232 49,852 280
Asset-backed securities ................................................ 15,781 3 3,361 (24)
Corporate debt and other securities .............................. 67,395 (27) 55,344 324
Equity securities ........................................................... 27,149 (30) 20,203 (117)
204,355 350 150,608 428
Included within the above figures are debt securities issued by banks and other financial institutions of US$36,153 million (2005:
US$16,888 million).
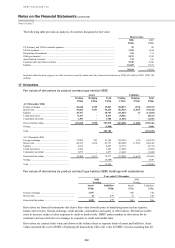
The following table analyses trading securities between those listed on a recognised exchange and those that are
unlisted:
Treasury
and other
eligible bills
Debt
securities
Equity
securities
Total
US$m US$m US$m US$m
Fair value at 31 December 2006
Listed on a recognised exchange1 ................................ 1,373 112,403 25,337 139,113
Unlisted ......................................................................... 20,386 43,044 1,812 65,242
21,759 155,447 27,149 204,355
Fair value at 31 December 2005
Listed on a recognised exchange1 ................................ 7,174 95,994 17,728 120,896
Unlisted ......................................................................... 5,572 21,665 2,475 29,712
12,746 117,659 20,203 150,608
1 Included within listed investments are US$4,309 million (2005: US$2,049 million) of investments listed in Hong Kong.