HSBC 2006 Annual Report Download - page 223
Download and view the complete annual report
Please find page 223 of the 2006 HSBC annual report below. You can navigate through the pages in the report by either clicking on the pages listed below, or by using the keyword search tool below to find specific information within the annual report.-
 1
1 -
2
-
3
-
4
-
5
-
6
-
7
-
8
-
9
-
10
-
11
-
12
-
13
-
14
-
15
-
16
-
17
-
18
-
19
-
20
-
21
-
22
-
23
-
24
-
25
-
26
-
27
-
28
-
29
-
30
-
31
-
32
-
33
-
34
-
35
-
36
-
37
-
38
-
39
-
40
-
41
-
42
-
43
-
44
-
45
-
46
-
47
-
48
-
49
-
50
-
51
-
52
-
53
-
54
-
55
-
56
-
57
-
58
-
59
-
60
-
61
-
62
-
63
-
64
-
65
-
66
-
67
-
68
-
69
-
70
-
71
-
72
-
73
-
74
-
75
-
76
-
77
-
78
-
79
-
80
-
81
-
82
-
83
-
84
-
85
-
86
-
87
-
88
-
89
-
90
-
91
-
92
-
93
-
94
-
95
-
96
-
97
-
98
-
99
-
100
-
101
-
102
-
103
-
104
-
105
-
106
-
107
-
108
-
109
-
110
-
111
-
112
-
113
-
114
-
115
-
116
-
117
-
118
-
119
-
120
-
121
-
122
-
123
-
124
-
125
-
126
-
127
-
128
-
129
-
130
-
131
-
132
-
133
-
134
-
135
-
136
-
137
-
138
-
139
-
140
-
141
-
142
-
143
-
144
-
145
-
146
-
147
-
148
-
149
-
150
-
151
-
152
-
153
-
154
-
155
-
156
-
157
-
158
-
159
-
160
-
161
-
162
-
163
-
164
-
165
-
166
-
167
-
168
-
169
-
170
-
171
-
172
-
173
-
174
-
175
-
176
-
177
-
178
-
179
-
180
-
181
-
182
-
183
-
184
-
185
-
186
-
187
-
188
-
189
-
190
-
191
-
192
-
193
-
194
-
195
-
196
-
197
-
198
-
199
-
200
-
201
-
202
-
203
-
204
-
205
-
206
-
207
-
208
-
209
-
210
-
211
-
212
-
 213
213 -
 214
214 -
 215
215 -
 216
216 -
 217
217 -
 218
218 -
 219
219 -
 220
220 -
 221
221 -
 222
222 -
 223
223 -
 224
224 -
 225
225 -
 226
226 -
 227
227 -
 228
228 -
 229
229 -
 230
230 -
 231
231 -
 232
232 -
 233
233 -
234
-
235
-
236
-
237
-
238
-
239
-
240
-
241
-
242
-
243
-
244
-
245
-
246
-
247
-
248
-
249
-
250
-
251
-
252
-
253
-
254
-
255
-
256
-
257
-
258
-
259
-
260
-
261
-
262
-
263
-
264
-
265
-
266
-
267
-
268
-
269
-
270
-
271
-
272
-
273
-
274
-
275
-
276
-
277
-
278
-
279
-
280
-
281
-
282
-
283
-
284
-
285
-
286
-
287
-
288
-
289
-
290
-
291
-
292
-
293
-
294
-
295
-
296
-
297
-
298
-
299
-
300
-
301
-
302
-
303
-
304
-
305
-
306
-
307
-
308
-
309
-
310
-
311
-
312
-
313
-
314
-
315
-
316
-
317
-
318
-
319
-
320
-
321
-
322
-
323
-
324
-
325
-
326
-
327
-
328
-
329
-
330
-
331
-
332
-
333
-
334
-
335
-
336
-
337
-
338
-
339
-
340
-
341
-
342
-
343
-
344
-
345
-
346
-
347
-
348
-
349
-
350
-
351
-
352
-
353
-
354
-
355
-
356
-
357
-
358
-
359
-
360
-
361
-
362
-
363
-
364
-
365
-
366
-
367
-
368
-
369
-
370
-
371
-
372
-
373
-
374
-
375
-
376
-
377
-
378
-
379
-
380
-
381
-
382
-
383
-
384
-
385
-
386
-
387
-
388
-
389
-
390
-
391
-
392
-
393
-
394
-
395
-
396
-
397
-
398
-
399
-
400
-
401
-
402
-
403
-
404
-
405
-
406
-
407
-
408
-
409
-
410
-
411
-
412
-
413
-
414
-
415
-
416
-
417
-
418
-
419
-
420
-
421
-
422
-
423
-
424
-
425
-
426
-
427
-
428
-
429
-
430
-
431
-
432
-
433
-
434
-
435
-
436
-
437
-
438
-
439
-
440
-
441
-
442
-
443
-
444
-
445
-
446
-
447
-
448
-
449
-
450
-
451
-
452
-
453
-
454
-
455
-
456
-
457
-
458
 |
 |
221
The present value of HSBC’s defined benefit
pension plans’ liabilities was US$32.2 billion at
31 December 2006, compared with US$27.7 billion
at 31 December 2005. Assets of the defined benefit
schemes at 31 December 2006 comprised: equity
investments 30 per cent (46 per cent at 31 December
2005); debt securities 56 per cent (33 per cent at
31 December 2005) and other (including property)
14 per cent (21 per cent at 31 December 2005). (See
Note 7 on the Financial Statements).
Sensitivity of net interest income
(Unaudited)
A principal part of HSBC’s management of market
risk in non-trading portfolios is to monitor the
sensitivity of projected net interest income under
varying interest rate scenarios (simulation
modelling). HSBC aims, through its management of
market risk in non-trading portfolios, to mitigate the
impact of prospective interest rate movements which
could reduce future net interest income, while
balancing the cost of such hedging activities on the
current net revenue stream.
For simulation modelling, businesses use a
combination of scenarios relevant to local businesses
and local markets and standard scenarios which are
required throughout HSBC. The standard scenarios
are consolidated to illustrate the combined pro forma
effect on HSBC’s consolidated portfolio valuations
and net interest income.
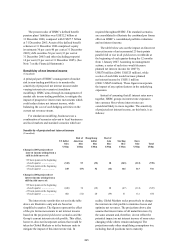
The table below sets out the impact on future net
interest income of an incremental 25 basis points
parallel fall or rise in all yield curves worldwide at
the beginning of each quarter during the 12 months
from 1 January 2007. Assuming no management
actions, a series of such rises would decrease
planned net interest income for 2007 by
US$578 million (2006: US$525 million), while
a series of such falls would increase planned
net interest income by US$511 million
(2006: US$474 million). These figures incorporate
the impact of any option features in the underlying
exposures.
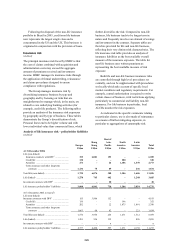
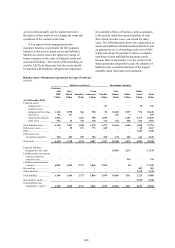
Instead of assuming that all interest rates move
together, HSBC groups its interest rate exposures
into currency blocs whose interest rates are
considered likely to move together. The sensitivity
of projected net interest income, on this basis, is as
follows:
Sensitivity of projected net interest income
(Unaudited)
US dollar
bloc
US$m
Rest of
Americas
bloc
US$m
Hong Kong
dollar
bloc
US$m
Rest of
Asia
bloc
US$m
Sterling
bloc
US$m
Euro
bloc
US$m
Total
US$m
Change in 2007 projected net
interest income arising from a
shift in yield curves of:
+25 basis points at the beginning
of each quarter ...................... (342) 53 (32) 18 (163) (112) (578)
–25 basis points at the beginning
of each quarter ...................... 249 (53) 52 (14) 164 113 511
Change in 2006 projected net
interest income arising from a
shift in yield curves of:
+25 basis points at the beginning
of each quarter ...................... (448) 74 (18) 28 (47) (114) (525)
–25 basis points at the beginning
of each quarter ...................... 402 (72) 20 (39) 51 112 474
The interest rate sensitivities set out in the table
above are illustrative only and are based on
simplified scenarios. The figures represent the effect
of the pro forma movements in net interest income
based on the projected yield curve scenarios and the
Group’s current interest rate risk profile. This effect,
however, does not incorporate actions that would be
taken by Global Markets or in the business units to
mitigate the impact of this interest rate risk. In
reality, Global Markets seeks proactively to change
the interest rate risk profile to minimise losses and
optimise net revenues. The projections above also
assume that interest rates of all maturities move by
the same amount and, therefore, do not reflect the
potential impact on net interest income of some rates
changing while others remain unchanged. The
projections make other simplifying assumptions too,
including that all positions run to maturity.