HSBC 2006 Annual Report Download - page 126
Download and view the complete annual report
Please find page 126 of the 2006 HSBC annual report below. You can navigate through the pages in the report by either clicking on the pages listed below, or by using the keyword search tool below to find specific information within the annual report.-
 1
1 -
2
-
3
-
4
-
5
-
6
-
7
-
8
-
9
-
10
-
11
-
12
-
13
-
14
-
15
-
16
-
17
-
18
-
19
-
20
-
21
-
22
-
23
-
24
-
25
-
26
-
27
-
28
-
29
-
30
-
31
-
32
-
33
-
34
-
35
-
36
-
37
-
38
-
39
-
40
-
41
-
42
-
43
-
44
-
45
-
46
-
47
-
48
-
49
-
50
-
51
-
52
-
53
-
54
-
55
-
56
-
57
-
58
-
59
-
60
-
61
-
62
-
63
-
64
-
65
-
66
-
67
-
68
-
69
-
70
-
71
-
72
-
73
-
74
-
75
-
76
-
77
-
78
-
79
-
80
-
81
-
82
-
83
-
84
-
85
-
86
-
87
-
88
-
89
-
90
-
91
-
92
-
93
-
94
-
95
-
96
-
97
-
98
-
99
-
100
-
101
-
102
-
103
-
104
-
105
-
106
-
107
-
108
-
109
-
110
-
111
-
112
-
113
-
114
-
115
-
 116
116 -
 117
117 -
 118
118 -
 119
119 -
 120
120 -
 121
121 -
 122
122 -
 123
123 -
 124
124 -
 125
125 -
 126
126 -
 127
127 -
 128
128 -
 129
129 -
 130
130 -
 131
131 -
 132
132 -
 133
133 -
 134
134 -
 135
135 -
 136
136 -
137
-
138
-
139
-
140
-
141
-
142
-
143
-
144
-
145
-
146
-
147
-
148
-
149
-
150
-
151
-
152
-
153
-
154
-
155
-
156
-
157
-
158
-
159
-
160
-
161
-
162
-
163
-
164
-
165
-
166
-
167
-
168
-
169
-
170
-
171
-
172
-
173
-
174
-
175
-
176
-
177
-
178
-
179
-
180
-
181
-
182
-
183
-
184
-
185
-
186
-
187
-
188
-
189
-
190
-
191
-
192
-
193
-
194
-
195
-
196
-
197
-
198
-
199
-
200
-
201
-
202
-
203
-
204
-
205
-
206
-
207
-
208
-
209
-
210
-
211
-
212
-
213
-
214
-
215
-
216
-
217
-
218
-
219
-
220
-
221
-
222
-
223
-
224
-
225
-
226
-
227
-
228
-
229
-
230
-
231
-
232
-
233
-
234
-
235
-
236
-
237
-
238
-
239
-
240
-
241
-
242
-
243
-
244
-
245
-
246
-
247
-
248
-
249
-
250
-
251
-
252
-
253
-
254
-
255
-
256
-
257
-
258
-
259
-
260
-
261
-
262
-
263
-
264
-
265
-
266
-
267
-
268
-
269
-
270
-
271
-
272
-
273
-
274
-
275
-
276
-
277
-
278
-
279
-
280
-
281
-
282
-
283
-
284
-
285
-
286
-
287
-
288
-
289
-
290
-
291
-
292
-
293
-
294
-
295
-
296
-
297
-
298
-
299
-
300
-
301
-
302
-
303
-
304
-
305
-
306
-
307
-
308
-
309
-
310
-
311
-
312
-
313
-
314
-
315
-
316
-
317
-
318
-
319
-
320
-
321
-
322
-
323
-
324
-
325
-
326
-
327
-
328
-
329
-
330
-
331
-
332
-
333
-
334
-
335
-
336
-
337
-
338
-
339
-
340
-
341
-
342
-
343
-
344
-
345
-
346
-
347
-
348
-
349
-
350
-
351
-
352
-
353
-
354
-
355
-
356
-
357
-
358
-
359
-
360
-
361
-
362
-
363
-
364
-
365
-
366
-
367
-
368
-
369
-
370
-
371
-
372
-
373
-
374
-
375
-
376
-
377
-
378
-
379
-
380
-
381
-
382
-
383
-
384
-
385
-
386
-
387
-
388
-
389
-
390
-
391
-
392
-
393
-
394
-
395
-
396
-
397
-
398
-
399
-
400
-
401
-
402
-
403
-
404
-
405
-
406
-
407
-
408
-
409
-
410
-
411
-
412
-
413
-
414
-
415
-
416
-
417
-
418
-
419
-
420
-
421
-
422
-
423
-
424
-
425
-
426
-
427
-
428
-
429
-
430
-
431
-
432
-
433
-
434
-
435
-
436
-
437
-
438
-
439
-
440
-
441
-
442
-
443
-
444
-
445
-
446
-
447
-
448
-
449
-
450
-
451
-
452
-
453
-
454
-
455
-
456
-
457
-
458
 |
 |

HSBC HOLDINGS PLC
Report of the Directors: Financial Review (continued)
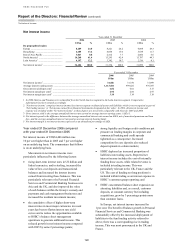
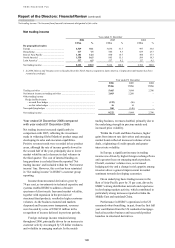
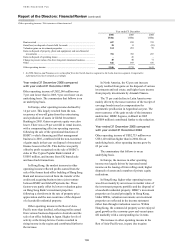
Net interest income / Net fee income
124
growth was 10 per cent. HSBC’s net interest margin
was 3.10 per cent in 2006, compared with 3.14 per
cent in 2005.
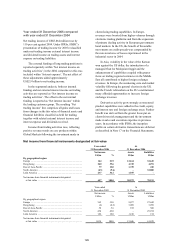
Year ended 31 December 2005 compared
with year ended 31 December 2004
Net interest income of US$31,334 million was
US$235 million, or 1 per cent, higher than in 2004.
Under IFRSs, HSBC’s presentation of net
interest income in 2005 was particularly affected by:
• the reclassification of certain preference
dividends within non-equity minority interests
as interest expense;
• the inclusion of certain loan origination fees and
expenses as part of an effective interest rate
calculation instead of being recognised in full on
inception of the loan; and
• external interest income and expense on trading
assets and liabilities now included within ‘Net
trading income’.
Adjusting for these changes and on an
underlying basis, net interest income increased by
12 per cent. The commentary that follows is on this
basis.
The benefit of strong growth in interest-earning
assets globally more than offset the effect of spread
compression from flattening yield curves in the
major currencies. This latter phenomenon reduced
opportunities for HSBC’s balance sheet management
operations to enhance margin by placing the Group’s
surplus liquidity longer term than the
behaviouralised deposit funding base. In addition,
short-term interest rate rises in the US reduced
spreads on consumer finance loans.
In Europe, higher personal and commercial
lending and increased deposit balances led to a
12 per cent increase in net interest income. UK
Personal Financial Services balances grew strongly
in mortgages, unsecured lending and cards, mainly
funded by a 12 per cent increase in deposit and
savings balances. In Turkey, card balances grew
from increased marketing and working with HSBC’s
retail partners. Spreads tightened on UK personal
lending, reflecting the introduction of preferential
pricing for lower-risk and higher-value customers,
and on savings, due to better pricing for customers.
In Commercial Banking in the UK, lending and
overdraft balances increased by 23 per cent, with
growth particularly strong in the property,
distribution and services sectors. Deposit balances
grew by 11 per cent, partly from keen pricing,
though this reduced deposit spreads. Yields on UK
corporate lending, which were lower largely as a
result of competitive pressure, were only partly
offset by higher loan balances, while lower balance
sheet management income reflected the effect of
rising short-term rates and flattening yield curves on
balance sheet management revenues.
In North America, net interest income increased
by 4 per cent. Growth in mortgage, card and
unsecured personal lending balances was strong,
offsetting spread contraction as the cost of funds rose
with progressive interest rate rises. Core deposit
growth benefited from expansion of the branch
network and the launch of new savings products,
including an online savings product which attracted
a significant number of new customers. Treasury
income from balance sheet management within
Corporate, Investment Banking and Markets
diminished as the rise in short-term interest rates
limited opportunities to profit from placing the
liquidity generated from core banking operations
over extended periods.
In Hong Kong, net interest income rose by
17 per cent. Rising interest rates reinvigorated
demand for traditional savings products, driving
increases in personal and commercial savings
balances. Coupled with the rise in deposit spreads,
which increased in line with interest rates, this led to
a sharp rise in net interest income. Mortgage spreads
contracted, however, as the gradual increase in
yields during the year, in line with higher rates, was
more than offset by rising funding costs. There was
little net new lending for residential mortgages as
interest rate rises cooled the residential property
market in the second half of 2005. Economic growth
in mainland China boosted commercial lending to
the trade and manufacturing sectors, and property
lending also increased. Treasury income remained
under pressure, with rising short-term interest rates
and a flat yield curve providing limited opportunities
to profitably deploy surplus liquidity and increasing
funding costs.
In the Rest of Asia-Pacific, net interest income
increased by 24 per cent, reflecting business
expansion and favourable economic conditions
throughout the region. In the Middle East, buoyant
oil-based economies stimulated demand for credit
for property and infrastructure projects. Increasing
personal and corporate wealth contributed to growth
in deposit balances, while interest rate rises led to
higher deposit spreads. General economic expansion
created demand for consumption credit which
boosted credit card lending. For the reasons noted
above, treasury income from balance sheet
management was weaker.