HSBC 2006 Annual Report Download - page 89
Download and view the complete annual report
Please find page 89 of the 2006 HSBC annual report below. You can navigate through the pages in the report by either clicking on the pages listed below, or by using the keyword search tool below to find specific information within the annual report.-
 1
1 -
2
-
3
-
4
-
5
-
6
-
7
-
8
-
9
-
10
-
11
-
12
-
13
-
14
-
15
-
16
-
17
-
18
-
19
-
20
-
21
-
22
-
23
-
24
-
25
-
26
-
27
-
28
-
29
-
30
-
31
-
32
-
33
-
34
-
35
-
36
-
37
-
38
-
39
-
40
-
41
-
42
-
43
-
44
-
45
-
46
-
47
-
48
-
49
-
50
-
51
-
52
-
53
-
54
-
55
-
56
-
57
-
58
-
59
-
60
-
61
-
62
-
63
-
64
-
65
-
66
-
67
-
68
-
69
-
70
-
71
-
72
-
73
-
74
-
75
-
76
-
77
-
78
-
 79
79 -
 80
80 -
 81
81 -
 82
82 -
 83
83 -
 84
84 -
 85
85 -
 86
86 -
 87
87 -
 88
88 -
 89
89 -
 90
90 -
 91
91 -
 92
92 -
 93
93 -
 94
94 -
 95
95 -
 96
96 -
 97
97 -
 98
98 -
 99
99 -
100
-
101
-
102
-
103
-
104
-
105
-
106
-
107
-
108
-
109
-
110
-
111
-
112
-
113
-
114
-
115
-
116
-
117
-
118
-
119
-
120
-
121
-
122
-
123
-
124
-
125
-
126
-
127
-
128
-
129
-
130
-
131
-
132
-
133
-
134
-
135
-
136
-
137
-
138
-
139
-
140
-
141
-
142
-
143
-
144
-
145
-
146
-
147
-
148
-
149
-
150
-
151
-
152
-
153
-
154
-
155
-
156
-
157
-
158
-
159
-
160
-
161
-
162
-
163
-
164
-
165
-
166
-
167
-
168
-
169
-
170
-
171
-
172
-
173
-
174
-
175
-
176
-
177
-
178
-
179
-
180
-
181
-
182
-
183
-
184
-
185
-
186
-
187
-
188
-
189
-
190
-
191
-
192
-
193
-
194
-
195
-
196
-
197
-
198
-
199
-
200
-
201
-
202
-
203
-
204
-
205
-
206
-
207
-
208
-
209
-
210
-
211
-
212
-
213
-
214
-
215
-
216
-
217
-
218
-
219
-
220
-
221
-
222
-
223
-
224
-
225
-
226
-
227
-
228
-
229
-
230
-
231
-
232
-
233
-
234
-
235
-
236
-
237
-
238
-
239
-
240
-
241
-
242
-
243
-
244
-
245
-
246
-
247
-
248
-
249
-
250
-
251
-
252
-
253
-
254
-
255
-
256
-
257
-
258
-
259
-
260
-
261
-
262
-
263
-
264
-
265
-
266
-
267
-
268
-
269
-
270
-
271
-
272
-
273
-
274
-
275
-
276
-
277
-
278
-
279
-
280
-
281
-
282
-
283
-
284
-
285
-
286
-
287
-
288
-
289
-
290
-
291
-
292
-
293
-
294
-
295
-
296
-
297
-
298
-
299
-
300
-
301
-
302
-
303
-
304
-
305
-
306
-
307
-
308
-
309
-
310
-
311
-
312
-
313
-
314
-
315
-
316
-
317
-
318
-
319
-
320
-
321
-
322
-
323
-
324
-
325
-
326
-
327
-
328
-
329
-
330
-
331
-
332
-
333
-
334
-
335
-
336
-
337
-
338
-
339
-
340
-
341
-
342
-
343
-
344
-
345
-
346
-
347
-
348
-
349
-
350
-
351
-
352
-
353
-
354
-
355
-
356
-
357
-
358
-
359
-
360
-
361
-
362
-
363
-
364
-
365
-
366
-
367
-
368
-
369
-
370
-
371
-
372
-
373
-
374
-
375
-
376
-
377
-
378
-
379
-
380
-
381
-
382
-
383
-
384
-
385
-
386
-
387
-
388
-
389
-
390
-
391
-
392
-
393
-
394
-
395
-
396
-
397
-
398
-
399
-
400
-
401
-
402
-
403
-
404
-
405
-
406
-
407
-
408
-
409
-
410
-
411
-
412
-
413
-
414
-
415
-
416
-
417
-
418
-
419
-
420
-
421
-
422
-
423
-
424
-
425
-
426
-
427
-
428
-
429
-
430
-
431
-
432
-
433
-
434
-
435
-
436
-
437
-
438
-
439
-
440
-
441
-
442
-
443
-
444
-
445
-
446
-
447
-
448
-
449
-
450
-
451
-
452
-
453
-
454
-
455
-
456
-
457
-
458
 |
 |
87
capital markets revenue improved from a low base
and higher income streams were generated from a
regular flow of new deals from asset-backed
securities. Global Transaction Banking fees rose,
reflecting higher customer volumes in payments and
cash management.
Income from trading activities increased, due in
part to higher revenues in the US from credit trading
following losses in 2004, and a tightening of credit
spreads. Business lines in which HSBC has invested,
such as equities and structured derivatives, also
showed strong year-on-year gains.
There was a reduction of US$24 million in the
net release of loan impairment allowances, primarily
due to the non-recurrence of a number of large
releases. New impairment allowances against
corporate clients remained broadly in line with last
year.
Operating expenses increased by 44 per cent to
US$1,376 million. In 2005, the proportionately
greater investment in North America compared with
other regions reflected HSBC’s commitment to
strengthen global reach by developing its presence in
this region. HSBC continued to invest throughout the
year in expanding product capabilities, particularly
in structured derivatives, equities, research,
mortgage-backed securities and advisory, and the
build-out of specialist sector teams in the US. Nearly
half of the incremental cost was attributable to this
investment.
Staff costs rose by 40 per cent, reflecting the full
year of recruitment in the latter part of 2004 and
selective hiring in 2005 which resulted in an increase
of 856 staff in Corporate, Investment Banking and
Markets in North America.
Non-staff costs grew correspondingly and
included the expense incurred in building critical
infrastructure and investment in new technology.
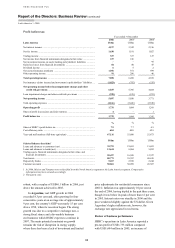
Private Banking contributed a pre-tax profit of
US$104 million, an increase of 55 per cent on 2004,
driven by growth in client assets and the balance
sheet, and the expansion of Wealth and Tax
Advisory Services (‘WTAS’).
Net interest income increased by 11 per cent.
Lending balances rose by over 30 per cent as clients
borrowed on a secured basis to make alternative
investments. Mortgage lending also grew, supported
by the launch of a ‘Tailored Mortgage’ product
during the year. Spreads on current accounts
increased by 40 basis points, reflecting the benefit of
interest rate increases during the year.
A number of smaller trust accounts were sold in
2005, generating one-off income of US$9 million.
This was partly offset by the non-recurrence of gains
from financial investments arising from the sale of
seed capital investments in 2004. Having expanded
its presence in New York, Philadelphia, Los
Angeles, San Francisco and Virginia through the
recruitment of fee-generating staff, and having
grown organically from referrals, WTAS contributed
to an increase of 13 per cent in fee income.
Client assets grew by 4 per cent to
US$40.8 billion, contributing to the rise in fee and
other operating income. US$1.8 billion of net new
money reflected client acquisition in the US, partly
offset by the divestment of trust accounts referred to
above. The ‘Strategic Investment Solutions’ product,
launched in March 2004, was markedly successful in
attracting new funds. Discretionary managed assets
invested in this product reached US$0.9 billion.
Operating expenses of US$324 million were
9 per cent higher than in 2004. The recruitment of
front office staff in Private Banking and new fee-
generating staff in WTAS added to the cost base.
This was partly offset by a reduction in staff
numbers through restructuring and the sale of the
trust account business referred to above.
Increased activity at HSBC’s North American
technology centre led to an increase in both costs
and net operating income in Other, as higher
network and systems maintenance costs and
development expenditure to meet increased
technological requirements were recharged to other
customer groups. Movements in the fair value of
own debt and the associated swaps designated at fair
value led to a US$401 million increase in total
operating income.