HSBC 2006 Annual Report Download - page 146
Download and view the complete annual report
Please find page 146 of the 2006 HSBC annual report below. You can navigate through the pages in the report by either clicking on the pages listed below, or by using the keyword search tool below to find specific information within the annual report.-
 1
1 -
2
-
3
-
4
-
5
-
6
-
7
-
8
-
9
-
10
-
11
-
12
-
13
-
14
-
15
-
16
-
17
-
18
-
19
-
20
-
21
-
22
-
23
-
24
-
25
-
26
-
27
-
28
-
29
-
30
-
31
-
32
-
33
-
34
-
35
-
36
-
37
-
38
-
39
-
40
-
41
-
42
-
43
-
44
-
45
-
46
-
47
-
48
-
49
-
50
-
51
-
52
-
53
-
54
-
55
-
56
-
57
-
58
-
59
-
60
-
61
-
62
-
63
-
64
-
65
-
66
-
67
-
68
-
69
-
70
-
71
-
72
-
73
-
74
-
75
-
76
-
77
-
78
-
79
-
80
-
81
-
82
-
83
-
84
-
85
-
86
-
87
-
88
-
89
-
90
-
91
-
92
-
93
-
94
-
95
-
96
-
97
-
98
-
99
-
100
-
101
-
102
-
103
-
104
-
105
-
106
-
107
-
108
-
109
-
110
-
111
-
112
-
113
-
114
-
115
-
116
-
117
-
118
-
119
-
120
-
121
-
122
-
123
-
124
-
125
-
126
-
127
-
128
-
129
-
130
-
131
-
132
-
133
-
134
-
135
-
 136
136 -
 137
137 -
 138
138 -
 139
139 -
 140
140 -
 141
141 -
 142
142 -
 143
143 -
 144
144 -
 145
145 -
 146
146 -
 147
147 -
 148
148 -
 149
149 -
 150
150 -
 151
151 -
 152
152 -
 153
153 -
 154
154 -
 155
155 -
 156
156 -
157
-
158
-
159
-
160
-
161
-
162
-
163
-
164
-
165
-
166
-
167
-
168
-
169
-
170
-
171
-
172
-
173
-
174
-
175
-
176
-
177
-
178
-
179
-
180
-
181
-
182
-
183
-
184
-
185
-
186
-
187
-
188
-
189
-
190
-
191
-
192
-
193
-
194
-
195
-
196
-
197
-
198
-
199
-
200
-
201
-
202
-
203
-
204
-
205
-
206
-
207
-
208
-
209
-
210
-
211
-
212
-
213
-
214
-
215
-
216
-
217
-
218
-
219
-
220
-
221
-
222
-
223
-
224
-
225
-
226
-
227
-
228
-
229
-
230
-
231
-
232
-
233
-
234
-
235
-
236
-
237
-
238
-
239
-
240
-
241
-
242
-
243
-
244
-
245
-
246
-
247
-
248
-
249
-
250
-
251
-
252
-
253
-
254
-
255
-
256
-
257
-
258
-
259
-
260
-
261
-
262
-
263
-
264
-
265
-
266
-
267
-
268
-
269
-
270
-
271
-
272
-
273
-
274
-
275
-
276
-
277
-
278
-
279
-
280
-
281
-
282
-
283
-
284
-
285
-
286
-
287
-
288
-
289
-
290
-
291
-
292
-
293
-
294
-
295
-
296
-
297
-
298
-
299
-
300
-
301
-
302
-
303
-
304
-
305
-
306
-
307
-
308
-
309
-
310
-
311
-
312
-
313
-
314
-
315
-
316
-
317
-
318
-
319
-
320
-
321
-
322
-
323
-
324
-
325
-
326
-
327
-
328
-
329
-
330
-
331
-
332
-
333
-
334
-
335
-
336
-
337
-
338
-
339
-
340
-
341
-
342
-
343
-
344
-
345
-
346
-
347
-
348
-
349
-
350
-
351
-
352
-
353
-
354
-
355
-
356
-
357
-
358
-
359
-
360
-
361
-
362
-
363
-
364
-
365
-
366
-
367
-
368
-
369
-
370
-
371
-
372
-
373
-
374
-
375
-
376
-
377
-
378
-
379
-
380
-
381
-
382
-
383
-
384
-
385
-
386
-
387
-
388
-
389
-
390
-
391
-
392
-
393
-
394
-
395
-
396
-
397
-
398
-
399
-
400
-
401
-
402
-
403
-
404
-
405
-
406
-
407
-
408
-
409
-
410
-
411
-
412
-
413
-
414
-
415
-
416
-
417
-
418
-
419
-
420
-
421
-
422
-
423
-
424
-
425
-
426
-
427
-
428
-
429
-
430
-
431
-
432
-
433
-
434
-
435
-
436
-
437
-
438
-
439
-
440
-
441
-
442
-
443
-
444
-
445
-
446
-
447
-
448
-
449
-
450
-
451
-
452
-
453
-
454
-
455
-
456
-
457
-
458
 |
 |

HSBC HOLDINGS PLC
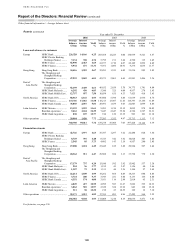
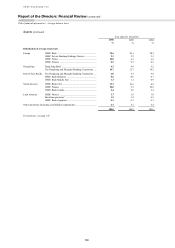
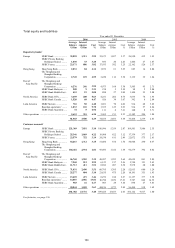
Report of the Directors: Financial Review (continued)
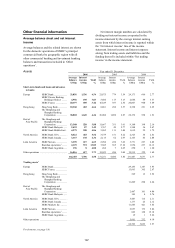
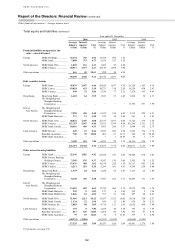
Asset deployment / Funds under management / Assets held in custody
144
driven by strong investment banking performance, a
buoyant stock market and rapid growth in Shariah-
compliant products and services.
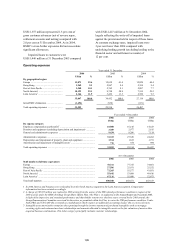
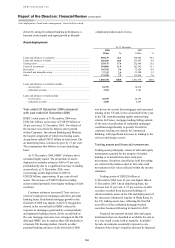
Asset deployment
At 31 December
2006 2005
US$m % US$m %
Loans and advances to customers .......................................................... 868,133 46.6 740,002 49.3
Loans and advances to banks ................................................................. 185,205 10.0 125,965 8.4
Trading assets ......................................................................................... 328,147 17.6 232,909 15.5
Financial investments ............................................................................. 204,806 11.0 182,342 12.1
Derivatives .............................................................................................. 103,702 5.6 73,928 4.9
Goodwill and intangible assets ............................................................... 37,335 2.0 33,200 2.2
Other ....................................................................................................... 133,430 7.2 113,624 7.6
1,860,758 100.0 1,501,970 100.0
Loans and advances to customers include:
– reverse repos ................................................................................... 18,755 14,610
– settlement accounts ........................................................................ 3,254 2,142
Loans and advances to banks include:
– reverse repos ................................................................................... 45,019 24,754
– settlement accounts ........................................................................ 2,028 2,669
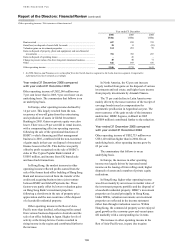
Year ended 31 December 2006 compared
with year ended 31 December 2005
HSBC’s total assets at 31 December 2006 were
US$1,861 billion, an increase of US$359 billion or
24 per cent since 31 December 2005. Two thirds of
the increase was driven by balance sheet growth
within Corporate, Investment Banking and Markets,
the largest component of which was trading assets.
Acquisitions added US$13 billion to total assets. On
an underlying basis, total assets grew by 17 per cent.
The commentary that follows is on an underlying
basis.
At 31 December 2006, HSBC’s balance sheet
remained highly liquid. The proportion of assets
deployed in customer advances fell to 47 per cent,
predominantly due to a significant increase in trading
assets which, at 31 December 2006, were
2 percentage points higher than in 2005 at
US$328 billion, representing 18 per cent of total
assets. The increase of US$95 billion in trading
assets resulted primarily from higher holdings of debt
securities.
Customer advances increased 17 per cent as a
result of expansion in mortgages and other personal
banking loans. Residential mortgage growth in the
first half of 2006 was mainly in the US, though this
slowed in the second half as HSBC reduced its
exposure to mortgages generated by correspondents
and tightened lending criteria. In the second half of
the year mortgage increases were strongest in the UK
although HSBC saw its market share fall modestly in
a buoyant UK housing market. Growth in other
personal banking advances in the first half of 2006
was driven by second lien mortgages and unsecured
lending in the US and, in the second half of the year,
in the UK, notwithstanding tighter underwriting
criteria. In France, mortgage lending falling outside
of the strict classification of residential mortgages
contributed significantly to growth. Growth in
corporate lending was mainly in Commercial
Banking, with significant increases in lending to the
services and energy sectors.
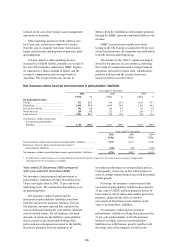
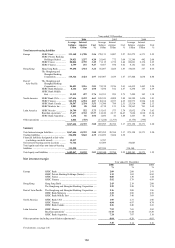
Trading assets and financial investments
Trading assets principally consist of debt and equity
instruments acquired for the purpose of market
making or to benefit from short-term price
movements. Securities classified as held for trading
are carried in the balance sheet at fair value with
movements in fair value reflected within the income
statement.
Trading assets of US$328 billion at
31 December 2006 were 41 per cent higher than at
31 December 2005. On an underlying basis, the
increase was 32 per cent. A 27 per cent rise in debt
securities resulted from increased holdings of
shorter-maturity assets in the UK and deployment of
the increased commercial surplus in Hong Kong. In
the US, trading assets rose, reflecting the first full
year effect of the residential mortgage-backed
securities business following its launch in 2005.
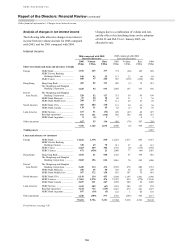
Financial investments include debt and equity
instruments that are classified as available for sale or,
to a very small extent, held to maturity. Available-
for-sale investments essentially represent a core
element of the Group’s liquidity and may be disposed