HSBC 2006 Annual Report Download - page 221
Download and view the complete annual report
Please find page 221 of the 2006 HSBC annual report below. You can navigate through the pages in the report by either clicking on the pages listed below, or by using the keyword search tool below to find specific information within the annual report.-
 1
1 -
2
-
3
-
4
-
5
-
6
-
7
-
8
-
9
-
10
-
11
-
12
-
13
-
14
-
15
-
16
-
17
-
18
-
19
-
20
-
21
-
22
-
23
-
24
-
25
-
26
-
27
-
28
-
29
-
30
-
31
-
32
-
33
-
34
-
35
-
36
-
37
-
38
-
39
-
40
-
41
-
42
-
43
-
44
-
45
-
46
-
47
-
48
-
49
-
50
-
51
-
52
-
53
-
54
-
55
-
56
-
57
-
58
-
59
-
60
-
61
-
62
-
63
-
64
-
65
-
66
-
67
-
68
-
69
-
70
-
71
-
72
-
73
-
74
-
75
-
76
-
77
-
78
-
79
-
80
-
81
-
82
-
83
-
84
-
85
-
86
-
87
-
88
-
89
-
90
-
91
-
92
-
93
-
94
-
95
-
96
-
97
-
98
-
99
-
100
-
101
-
102
-
103
-
104
-
105
-
106
-
107
-
108
-
109
-
110
-
111
-
112
-
113
-
114
-
115
-
116
-
117
-
118
-
119
-
120
-
121
-
122
-
123
-
124
-
125
-
126
-
127
-
128
-
129
-
130
-
131
-
132
-
133
-
134
-
135
-
136
-
137
-
138
-
139
-
140
-
141
-
142
-
143
-
144
-
145
-
146
-
147
-
148
-
149
-
150
-
151
-
152
-
153
-
154
-
155
-
156
-
157
-
158
-
159
-
160
-
161
-
162
-
163
-
164
-
165
-
166
-
167
-
168
-
169
-
170
-
171
-
172
-
173
-
174
-
175
-
176
-
177
-
178
-
179
-
180
-
181
-
182
-
183
-
184
-
185
-
186
-
187
-
188
-
189
-
190
-
191
-
192
-
193
-
194
-
195
-
196
-
197
-
198
-
199
-
200
-
201
-
202
-
203
-
204
-
205
-
206
-
207
-
208
-
209
-
210
-
 211
211 -
 212
212 -
 213
213 -
 214
214 -
 215
215 -
 216
216 -
 217
217 -
 218
218 -
 219
219 -
 220
220 -
 221
221 -
 222
222 -
 223
223 -
 224
224 -
 225
225 -
 226
226 -
 227
227 -
 228
228 -
 229
229 -
 230
230 -
 231
231 -
232
-
233
-
234
-
235
-
236
-
237
-
238
-
239
-
240
-
241
-
242
-
243
-
244
-
245
-
246
-
247
-
248
-
249
-
250
-
251
-
252
-
253
-
254
-
255
-
256
-
257
-
258
-
259
-
260
-
261
-
262
-
263
-
264
-
265
-
266
-
267
-
268
-
269
-
270
-
271
-
272
-
273
-
274
-
275
-
276
-
277
-
278
-
279
-
280
-
281
-
282
-
283
-
284
-
285
-
286
-
287
-
288
-
289
-
290
-
291
-
292
-
293
-
294
-
295
-
296
-
297
-
298
-
299
-
300
-
301
-
302
-
303
-
304
-
305
-
306
-
307
-
308
-
309
-
310
-
311
-
312
-
313
-
314
-
315
-
316
-
317
-
318
-
319
-
320
-
321
-
322
-
323
-
324
-
325
-
326
-
327
-
328
-
329
-
330
-
331
-
332
-
333
-
334
-
335
-
336
-
337
-
338
-
339
-
340
-
341
-
342
-
343
-
344
-
345
-
346
-
347
-
348
-
349
-
350
-
351
-
352
-
353
-
354
-
355
-
356
-
357
-
358
-
359
-
360
-
361
-
362
-
363
-
364
-
365
-
366
-
367
-
368
-
369
-
370
-
371
-
372
-
373
-
374
-
375
-
376
-
377
-
378
-
379
-
380
-
381
-
382
-
383
-
384
-
385
-
386
-
387
-
388
-
389
-
390
-
391
-
392
-
393
-
394
-
395
-
396
-
397
-
398
-
399
-
400
-
401
-
402
-
403
-
404
-
405
-
406
-
407
-
408
-
409
-
410
-
411
-
412
-
413
-
414
-
415
-
416
-
417
-
418
-
419
-
420
-
421
-
422
-
423
-
424
-
425
-
426
-
427
-
428
-
429
-
430
-
431
-
432
-
433
-
434
-
435
-
436
-
437
-
438
-
439
-
440
-
441
-
442
-
443
-
444
-
445
-
446
-
447
-
448
-
449
-
450
-
451
-
452
-
453
-
454
-
455
-
456
-
457
-
458
 |
 |
219
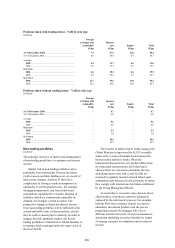
Positions taken with trading intent – VAR by risk type
(Audited)
Foreign
exchange and
commodity
Interest
rate
Equity Total
US$m US$m US$m US$m
At 31 December 2006 .................................................. 7.3 27.9 11.8 30.2
At 31 December 2005 ................................................... 4.6 28.4 4.7 30.1
Average
2006 .......................................................................... 6.3 31.7 6.5 31.6
2005 .......................................................................... 6.9 33.3 5.5 33.5
Minimum
2006 .......................................................................... 2.6 18.3 2.6 19.9
2005 .......................................................................... 2.9 25.5 2.3 25.7
Maximum
2006 .......................................................................... 12.7 49.6 11.8 48.2
2005 .......................................................................... 12.4 49.0 10.9 46.7
Positions taken without trading intent – VAR by risk type
(Audited)
Foreign
exchange and
commodity
Interest
rate Equity Total
US$m US$m US$m US$m
At 31 December 2006 .................................................. – 4.7 – 4.7
At 31 December 2005 ................................................... – 6.9 – 6.9
Average
2006 .......................................................................... – 5.6 – 5.6
2005 .......................................................................... – 8.6 – 8.6
Minimum
2006 .......................................................................... – 2.5 – 2.5
2005 .......................................................................... – 1.4 – 1.4
Maximum
2006 .......................................................................... – 10.5 – 10.5
2005 .......................................................................... – 24.5 – 24.5
Non-trading portfolios
(Audited)
The principal objective of market risk management
of non-trading portfolios is to optimise net interest
income.
Market risk in non-trading portfolios arises
principally from mismatches between the future
yield on assets and their funding cost, as a result of
interest rate changes. Analysis of this risk is
complicated by having to make assumptions on
optionality in certain product areas, for example,
mortgage prepayments, and from behavioural
assumptions regarding the economic duration of
liabilities which are contractually repayable on
demand, for example, current accounts. The
prospective change in future net interest income
from non-trading portfolios will be reflected in the
current realisable value of these positions, should
they be sold or closed prior to maturity. In order to
manage this risk optimally, market risk in non-
trading portfolios is transferred to Global Markets or
to separate books managed under the supervision of
the local ALCO.
The transfer of market risk to books managed by
Global Markets or supervised by ALCO is usually
achieved by a series of internal deals between the
business units and these books. When the
behavioural characteristics of a product differ from
its contractual characteristics, the behavioural
characteristics are assessed to determine the true
underlying interest rate risk. Local ALCOs are
required to regularly monitor all such behavioural
assumptions and interest rate risk positions, to ensure
they comply with interest rate risk limits established
by the Group Management Board.
As noted above, in certain cases, the non-linear
characteristics of products cannot be adequately
captured by the risk transfer process. For example,
both the flow from customer deposit accounts to
alternative investment products and the precise
prepayment speeds of mortgages will vary at
different interest rate levels. In such circumstances,
simulation modelling is used to identify the impact
of varying scenarios on valuations and net interest
income.