HSBC 2006 Annual Report Download - page 248
Download and view the complete annual report
Please find page 248 of the 2006 HSBC annual report below. You can navigate through the pages in the report by either clicking on the pages listed below, or by using the keyword search tool below to find specific information within the annual report.-
 1
1 -
2
-
3
-
4
-
5
-
6
-
7
-
8
-
9
-
10
-
11
-
12
-
13
-
14
-
15
-
16
-
17
-
18
-
19
-
20
-
21
-
22
-
23
-
24
-
25
-
26
-
27
-
28
-
29
-
30
-
31
-
32
-
33
-
34
-
35
-
36
-
37
-
38
-
39
-
40
-
41
-
42
-
43
-
44
-
45
-
46
-
47
-
48
-
49
-
50
-
51
-
52
-
53
-
54
-
55
-
56
-
57
-
58
-
59
-
60
-
61
-
62
-
63
-
64
-
65
-
66
-
67
-
68
-
69
-
70
-
71
-
72
-
73
-
74
-
75
-
76
-
77
-
78
-
79
-
80
-
81
-
82
-
83
-
84
-
85
-
86
-
87
-
88
-
89
-
90
-
91
-
92
-
93
-
94
-
95
-
96
-
97
-
98
-
99
-
100
-
101
-
102
-
103
-
104
-
105
-
106
-
107
-
108
-
109
-
110
-
111
-
112
-
113
-
114
-
115
-
116
-
117
-
118
-
119
-
120
-
121
-
122
-
123
-
124
-
125
-
126
-
127
-
128
-
129
-
130
-
131
-
132
-
133
-
134
-
135
-
136
-
137
-
138
-
139
-
140
-
141
-
142
-
143
-
144
-
145
-
146
-
147
-
148
-
149
-
150
-
151
-
152
-
153
-
154
-
155
-
156
-
157
-
158
-
159
-
160
-
161
-
162
-
163
-
164
-
165
-
166
-
167
-
168
-
169
-
170
-
171
-
172
-
173
-
174
-
175
-
176
-
177
-
178
-
179
-
180
-
181
-
182
-
183
-
184
-
185
-
186
-
187
-
188
-
189
-
190
-
191
-
192
-
193
-
194
-
195
-
196
-
197
-
198
-
199
-
200
-
201
-
202
-
203
-
204
-
205
-
206
-
207
-
208
-
209
-
210
-
211
-
212
-
213
-
214
-
215
-
216
-
217
-
218
-
219
-
220
-
221
-
222
-
223
-
224
-
225
-
226
-
227
-
228
-
229
-
230
-
231
-
232
-
233
-
234
-
235
-
236
-
237
-
 238
238 -
 239
239 -
 240
240 -
 241
241 -
 242
242 -
 243
243 -
 244
244 -
 245
245 -
 246
246 -
 247
247 -
 248
248 -
 249
249 -
 250
250 -
 251
251 -
 252
252 -
 253
253 -
 254
254 -
 255
255 -
 256
256 -
 257
257 -
 258
258 -
259
-
260
-
261
-
262
-
263
-
264
-
265
-
266
-
267
-
268
-
269
-
270
-
271
-
272
-
273
-
274
-
275
-
276
-
277
-
278
-
279
-
280
-
281
-
282
-
283
-
284
-
285
-
286
-
287
-
288
-
289
-
290
-
291
-
292
-
293
-
294
-
295
-
296
-
297
-
298
-
299
-
300
-
301
-
302
-
303
-
304
-
305
-
306
-
307
-
308
-
309
-
310
-
311
-
312
-
313
-
314
-
315
-
316
-
317
-
318
-
319
-
320
-
321
-
322
-
323
-
324
-
325
-
326
-
327
-
328
-
329
-
330
-
331
-
332
-
333
-
334
-
335
-
336
-
337
-
338
-
339
-
340
-
341
-
342
-
343
-
344
-
345
-
346
-
347
-
348
-
349
-
350
-
351
-
352
-
353
-
354
-
355
-
356
-
357
-
358
-
359
-
360
-
361
-
362
-
363
-
364
-
365
-
366
-
367
-
368
-
369
-
370
-
371
-
372
-
373
-
374
-
375
-
376
-
377
-
378
-
379
-
380
-
381
-
382
-
383
-
384
-
385
-
386
-
387
-
388
-
389
-
390
-
391
-
392
-
393
-
394
-
395
-
396
-
397
-
398
-
399
-
400
-
401
-
402
-
403
-
404
-
405
-
406
-
407
-
408
-
409
-
410
-
411
-
412
-
413
-
414
-
415
-
416
-
417
-
418
-
419
-
420
-
421
-
422
-
423
-
424
-
425
-
426
-
427
-
428
-
429
-
430
-
431
-
432
-
433
-
434
-
435
-
436
-
437
-
438
-
439
-
440
-
441
-
442
-
443
-
444
-
445
-
446
-
447
-
448
-
449
-
450
-
451
-
452
-
453
-
454
-
455
-
456
-
457
-
458
 |
 |

HSBC HOLDINGS PLC
Report of the Directors: The Management of Risk (continued)
Capital management and allocation > Capital measurement
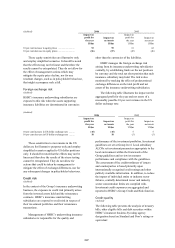
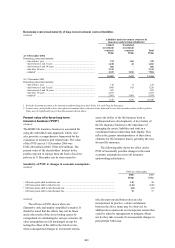
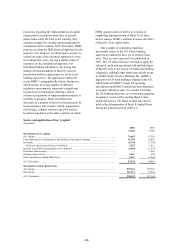
246
Capital structure
(Unaudited)
2006
US$m
2005
US$m
Composition of regulatory capital
Tier 1 capital
Shareholders’ funds ......................................................................................................................... 108,352 92,432
Minority interests and preference shares ........................................................................................ 7,413 6,741
Innovative tier 1 securities .............................................................................................................. 9,932 9,383
Less :
Goodwill capitalised and intangible assets ................................................................................. (36,489) (32,821)
Other regulatory adjustments ...................................................................................................... (1,366) (1,332)
Total qualifying tier 1 capital .......................................................................................................... 87,842 74,403
Tier 2 capital
Reserves arising from revaluation of property and unrealised gains on
available-for-sale equities ........................................................................................................... 2,982 1,593
Collective impairment allowances .................................................................................................. 11,077 8,749
Perpetual subordinated liabilities .................................................................................................... 3,396 3,640
Term subordinated liabilities .......................................................................................................... 30,677 24,519
Minority interests in tier 2 capital ................................................................................................... 425 425
Total qualifying tier 2 capital .......................................................................................................... 48,557 38,926
Unconsolidated investments ........................................................................................................... (7,512) (6,437)
Investments in other banks .............................................................................................................. (1,419) (1,147)
Other deductions ............................................................................................................................. (394) (296)
Total regulatory capital ................................................................................................................... 127,074 105,449
Risk-weighted assets
Banking book ....................................................................................................................................... 857,198 762,037
Trading book ........................................................................................................................................ 81,480 65,127
Total ..................................................................................................................................................... 938,678 827,164
Risk-weighted assets were included in the totals above in respect of:
– contingent liabilities ..................................................................................................................... 44,704 43,333
– commitments ................................................................................................................................ 58,569 51,288
Capital ratios % %
Total capital ......................................................................................................................................... 13.5 12.8
Tier 1 capital ........................................................................................................................................ 9.4 9.0
The above figures were computed in accordance
with the EU Banking Consolidation Directive.
Tier 1 capital increased by US$13.4 billion.
Retained profits contributed US$7.0 billion, shares
issued, including shares issued in lieu of dividends,
contributed US$3.5 billion and exchange differences
added US$4.6 billion. These increases were partly
offset by an increase in goodwill and intangible
assets, which are deducted from capital, of
US$3.7 billion, and is mainly due to the acquisition
of Grupo Banistmo as well as the weakening of the
US dollar against the pound sterling and the euro.
Total risk-weighted assets increased by
US$112 billion, or 13.5 per cent. The increase
mainly reflects growth in the loan book and trading
positions. At constant currency, risk-weighted asset
growth was 8.9 per cent.