HSBC 2006 Annual Report Download - page 143
Download and view the complete annual report
Please find page 143 of the 2006 HSBC annual report below. You can navigate through the pages in the report by either clicking on the pages listed below, or by using the keyword search tool below to find specific information within the annual report.-
 1
1 -
 2
2 -
 3
3 -
 4
4 -
 5
5 -
 6
6 -
 7
7 -
 8
8 -
 9
9 -
 10
10 -
 11
11 -
 12
12 -
 13
13 -
 14
14 -
 15
15 -
 16
16 -
 17
17 -
 18
18 -
 19
19 -
 20
20 -
 21
21 -
 22
22 -
 23
23 -
 24
24 -
 25
25 -
 26
26 -
 27
27 -
 28
28 -
 29
29 -
 30
30 -
 31
31 -
 32
32 -
 33
33 -
 34
34 -
 35
35 -
 36
36 -
 37
37 -
 38
38 -
 39
39 -
 40
40 -
 41
41 -
 42
42 -
 43
43 -
 44
44 -
 45
45 -
 46
46 -
 47
47 -
 48
48 -
 49
49 -
 50
50 -
 51
51 -
 52
52 -
 53
53 -
 54
54 -
 55
55 -
 56
56 -
 57
57 -
 58
58 -
 59
59 -
 60
60 -
 61
61 -
 62
62 -
 63
63 -
 64
64 -
 65
65 -
 66
66 -
 67
67 -
 68
68 -
 69
69 -
 70
70 -
 71
71 -
 72
72 -
 73
73 -
 74
74 -
 75
75 -
 76
76 -
 77
77 -
 78
78 -
 79
79 -
 80
80 -
 81
81 -
 82
82 -
 83
83 -
 84
84 -
 85
85 -
 86
86 -
 87
87 -
 88
88 -
 89
89 -
 90
90 -
 91
91 -
 92
92 -
 93
93 -
 94
94 -
 95
95 -
 96
96 -
 97
97 -
 98
98 -
 99
99 -
 100
100 -
 101
101 -
 102
102 -
 103
103 -
 104
104 -
 105
105 -
 106
106 -
 107
107 -
 108
108 -
 109
109 -
 110
110 -
 111
111 -
 112
112 -
 113
113 -
 114
114 -
 115
115 -
 116
116 -
 117
117 -
 118
118 -
 119
119 -
 120
120 -
 121
121 -
 122
122 -
 123
123 -
 124
124 -
 125
125 -
 126
126 -
 127
127 -
 128
128 -
 129
129 -
 130
130 -
 131
131 -
 132
132 -
 133
133 -
 134
134 -
 135
135 -
 136
136 -
 137
137 -
 138
138 -
 139
139 -
 140
140 -
 141
141 -
 142
142 -
 143
143 -
 144
144 -
 145
145 -
 146
146 -
 147
147 -
 148
148 -
 149
149 -
 150
150 -
 151
151 -
 152
152 -
 153
153 -
 154
154 -
 155
155 -
 156
156 -
 157
157 -
 158
158 -
 159
159 -
 160
160 -
 161
161 -
 162
162 -
 163
163 -
 164
164 -
 165
165 -
 166
166 -
 167
167 -
 168
168 -
 169
169 -
 170
170 -
 171
171 -
 172
172 -
 173
173 -
 174
174 -
 175
175 -
 176
176 -
 177
177 -
 178
178 -
 179
179 -
 180
180 -
 181
181 -
 182
182 -
 183
183 -
 184
184 -
 185
185 -
 186
186 -
 187
187 -
 188
188 -
 189
189 -
 190
190 -
 191
191 -
 192
192 -
 193
193 -
 194
194 -
 195
195 -
 196
196 -
 197
197 -
 198
198 -
 199
199 -
 200
200 -
 201
201 -
 202
202 -
 203
203 -
 204
204 -
 205
205 -
 206
206 -
 207
207 -
 208
208 -
 209
209 -
 210
210 -
 211
211 -
 212
212 -
 213
213 -
 214
214 -
 215
215 -
 216
216 -
 217
217 -
 218
218 -
 219
219 -
 220
220 -
 221
221 -
 222
222 -
 223
223 -
 224
224 -
 225
225 -
 226
226 -
 227
227 -
 228
228 -
 229
229 -
 230
230 -
 231
231 -
 232
232 -
 233
233 -
 234
234 -
 235
235 -
 236
236 -
 237
237 -
 238
238 -
 239
239 -
 240
240 -
 241
241 -
 242
242 -
 243
243 -
 244
244 -
 245
245 -
 246
246 -
 247
247 -
 248
248 -
 249
249 -
 250
250 -
 251
251 -
 252
252 -
 253
253 -
 254
254 -
 255
255 -
 256
256 -
 257
257 -
 258
258 -
 259
259 -
 260
260 -
 261
261 -
 262
262 -
 263
263 -
 264
264 -
 265
265 -
 266
266 -
 267
267 -
 268
268 -
 269
269 -
 270
270 -
 271
271 -
 272
272 -
 273
273 -
 274
274 -
 275
275 -
 276
276 -
 277
277 -
 278
278 -
 279
279 -
 280
280 -
 281
281 -
 282
282 -
 283
283 -
 284
284 -
 285
285 -
 286
286 -
 287
287 -
 288
288 -
 289
289 -
 290
290 -
 291
291 -
 292
292 -
 293
293 -
 294
294 -
 295
295 -
 296
296 -
 297
297 -
 298
298 -
 299
299 -
 300
300 -
 301
301 -
 302
302 -
 303
303 -
 304
304 -
 305
305 -
 306
306 -
 307
307 -
 308
308 -
 309
309 -
 310
310 -
 311
311 -
 312
312 -
 313
313 -
 314
314 -
 315
315 -
 316
316 -
 317
317 -
 318
318 -
 319
319 -
 320
320 -
 321
321 -
 322
322 -
 323
323 -
 324
324 -
 325
325 -
 326
326 -
 327
327 -
 328
328 -
 329
329 -
 330
330 -
 331
331 -
 332
332 -
 333
333 -
 334
334 -
 335
335 -
 336
336 -
 337
337 -
 338
338 -
 339
339 -
 340
340 -
 341
341 -
 342
342 -
 343
343 -
 344
344 -
 345
345 -
 346
346 -
 347
347 -
 348
348 -
 349
349 -
 350
350 -
 351
351 -
 352
352 -
 353
353 -
 354
354 -
 355
355 -
 356
356 -
 357
357 -
 358
358 -
 359
359 -
 360
360 -
 361
361 -
 362
362 -
 363
363 -
 364
364 -
 365
365 -
 366
366 -
 367
367 -
 368
368 -
 369
369 -
 370
370 -
 371
371 -
 372
372 -
 373
373 -
 374
374 -
 375
375 -
 376
376 -
 377
377 -
 378
378 -
 379
379 -
 380
380 -
 381
381 -
 382
382 -
 383
383 -
 384
384 -
 385
385 -
 386
386 -
 387
387 -
 388
388 -
 389
389 -
 390
390 -
 391
391 -
 392
392 -
 393
393 -
 394
394 -
 395
395 -
 396
396 -
 397
397 -
 398
398 -
 399
399 -
 400
400 -
 401
401 -
 402
402 -
 403
403 -
 404
404 -
 405
405 -
 406
406 -
 407
407 -
 408
408 -
 409
409 -
 410
410 -
 411
411 -
 412
412 -
 413
413 -
 414
414 -
 415
415 -
 416
416 -
 417
417 -
 418
418 -
 419
419 -
 420
420 -
 421
421 -
 422
422 -
 423
423 -
 424
424 -
 425
425 -
 426
426 -
 427
427 -
 428
428 -
 429
429 -
 430
430 -
 431
431 -
 432
432 -
 433
433 -
 434
434 -
 435
435 -
 436
436 -
 437
437 -
 438
438 -
 439
439 -
 440
440 -
 441
441 -
 442
442 -
 443
443 -
 444
444 -
 445
445 -
 446
446 -
 447
447 -
 448
448 -
 449
449 -
 450
450 -
 451
451 -
 452
452 -
 453
453 -
 454
454 -
 455
455 -
 456
456 -
 457
457 -
 458
458
 |
 |
141
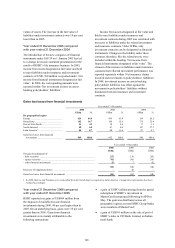
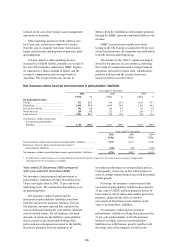
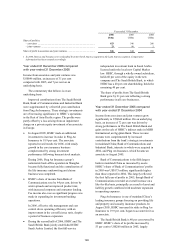
initiatives. Cost growth in Canada followed higher
revenues. The first full year effect of the expansion
of various Corporate, Investment Banking and
Markets businesses that commenced last year,
together with higher performance-linked pay
contributed further to the expense growth.
In Latin America, operating expenses rose by
12 per cent. Staff costs grew as additional staff were
recruited to support business expansion and pay rises
were agreed with the unions. Marketing expenditure
was higher as a consequence of advertising
campaigns run by Personal Financial Services and
Commercial Banking. The continued expansion of
the branch network and ATM infrastructure in
Mexico, in conjunction with construction of the new
headquarters, also contributed to the overall cost
growth in the region. Costs rose in Corporate,
Investment Banking and Markets in line with higher
transactional volumes, increased headcount and
union-agreed pay rises.
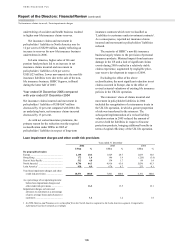
Year ended 31 December 2005 compared
with year ended 31 December 2004
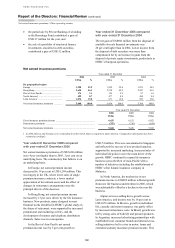
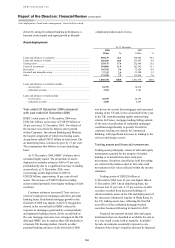
Operating expenses of US$29,514 million were
US$3,027 million, or 11 per cent, higher than in
2004. On an underlying basis, cost growth was 9 per
cent, trailing net operating income growth before
impairment charges by 3 percentage points. This
resulted in a slight improvement in the cost
efficiency ratio to 51 per cent. The three main
drivers of cost growth were as follows:
• volume expansion in many markets drove both
revenue and costs. In Personal Financial
Services and Commercial Banking, business
expansion drove cost growth of 6 per cent and
4 per cent respectively, though this was
exceeded by growth in net operating income
before loan impairment charges of 11 per cent
and 15 per cent respectively. In Mexico, Turkey
and Brazil, cost increases contributed over half
of the overall increase, but were significantly
exceeded by income growth;
• HSBC continued to improve productivity in
mature markets. In the UK, reorganisations in
Personal Financial Services and Commercial
Banking in 2004 resulted, in aggregate, in
broadly flat costs compared with growth of
10 per cent in net operating income before loan
impairment charges. This was delivered through
greater utilisation of direct channels, improved
training and increased incentives. In Hong
Kong, the promotion of cost-efficient delivery
channels and greater utilisation of the Group
Service Centres contributed to a 6 percentage
point improvement in the cost efficiency ratios
in Personal Financial Services and Commercial
Banking; and
• following a number of senior hires in 2004 in
Corporate, Investment Banking and Markets,
subsequent investment was focused on
operations and technology, to support revenue
growth. Non-staff costs increased by 23 per cent
in 2005, with staff costs growing by 14 per cent.
The rate of cost growth peaked during the year
and the cost efficiency ratio was 2 percentage
points better in the second half of the year than
the first half, as net operating income before
loan impairment charges grew faster than costs.
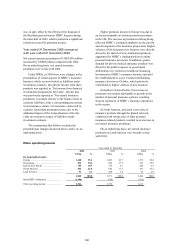
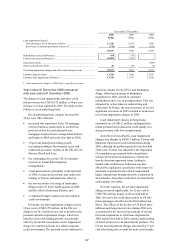
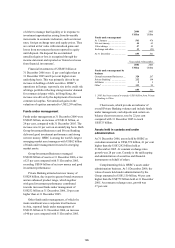
The following points are also of note. In Europe,
costs included the rebranding of the Group’s
operations in France, the refurbishment of 60 UK
branches and increased marketing costs. These
increases were offset by lower costs in Commercial
Banking in the UK following restructuring activity
in 2004. Costs in Corporate, Investment Banking and
Markets increased by 9 per cent, reflecting increased
staff numbers and investments in technology and
infrastructure.
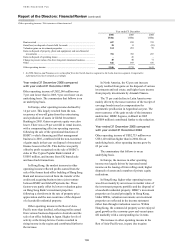
In Hong Kong, higher operating expenses
reflected business expansion in Corporate,
Investment Banking and Markets, supported by
increased staff in the investment banking division
and the recruitment of senior relationship managers.
This was partly offset by the effect of branch
restructuring and increased utilisation of the Group
Service Centres in Personal Financial Services,
which led to a 4 per cent fall in branch headcount.
Underlying operating expenses in the Rest of
Asia-Pacific increased by 31 per cent, reflecting
investment in broadening the customer base and the
distribution platform. HSBC’s branch network was
extended in mainland China, South Korea, and India,
and additional sales and support staff were recruited
in Personal Financial Services and Commercial
Banking. Staff numbers also increased in response to
the migration of call centre activities to the Group
Service Centres in the region. Growth initiatives
required investment in infrastructure and technology,
and accordingly non-staff costs increased by 39 per
cent.
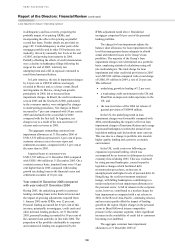
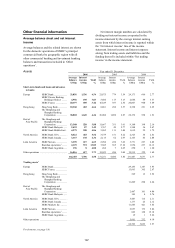
In North America, costs bore a particularly large
share of the investment in Corporate, Investment
Banking and Markets, reflecting HSBC’s
commitment to growing its presence in the region.
Costs also reflected the expansion of the network,
with the opening of 27 new branches in 2005 and the
launch of HSBC’s online savings account in the US.
