HSBC 2006 Annual Report Download - page 201
Download and view the complete annual report
Please find page 201 of the 2006 HSBC annual report below. You can navigate through the pages in the report by either clicking on the pages listed below, or by using the keyword search tool below to find specific information within the annual report.-
 1
1 -
2
-
3
-
4
-
5
-
6
-
7
-
8
-
9
-
10
-
11
-
12
-
13
-
14
-
15
-
16
-
17
-
18
-
19
-
20
-
21
-
22
-
23
-
24
-
25
-
26
-
27
-
28
-
29
-
30
-
31
-
32
-
33
-
34
-
35
-
36
-
37
-
38
-
39
-
40
-
41
-
42
-
43
-
44
-
45
-
46
-
47
-
48
-
49
-
50
-
51
-
52
-
53
-
54
-
55
-
56
-
57
-
58
-
59
-
60
-
61
-
62
-
63
-
64
-
65
-
66
-
67
-
68
-
69
-
70
-
71
-
72
-
73
-
74
-
75
-
76
-
77
-
78
-
79
-
80
-
81
-
82
-
83
-
84
-
85
-
86
-
87
-
88
-
89
-
90
-
91
-
92
-
93
-
94
-
95
-
96
-
97
-
98
-
99
-
100
-
101
-
102
-
103
-
104
-
105
-
106
-
107
-
108
-
109
-
110
-
111
-
112
-
113
-
114
-
115
-
116
-
117
-
118
-
119
-
120
-
121
-
122
-
123
-
124
-
125
-
126
-
127
-
128
-
129
-
130
-
131
-
132
-
133
-
134
-
135
-
136
-
137
-
138
-
139
-
140
-
141
-
142
-
143
-
144
-
145
-
146
-
147
-
148
-
149
-
150
-
151
-
152
-
153
-
154
-
155
-
156
-
157
-
158
-
159
-
160
-
161
-
162
-
163
-
164
-
165
-
166
-
167
-
168
-
169
-
170
-
171
-
172
-
173
-
174
-
175
-
176
-
177
-
178
-
179
-
180
-
181
-
182
-
183
-
184
-
185
-
186
-
187
-
188
-
189
-
190
-
 191
191 -
 192
192 -
 193
193 -
 194
194 -
 195
195 -
 196
196 -
 197
197 -
 198
198 -
 199
199 -
 200
200 -
 201
201 -
 202
202 -
 203
203 -
 204
204 -
 205
205 -
 206
206 -
 207
207 -
 208
208 -
 209
209 -
 210
210 -
 211
211 -
212
-
213
-
214
-
215
-
216
-
217
-
218
-
219
-
220
-
221
-
222
-
223
-
224
-
225
-
226
-
227
-
228
-
229
-
230
-
231
-
232
-
233
-
234
-
235
-
236
-
237
-
238
-
239
-
240
-
241
-
242
-
243
-
244
-
245
-
246
-
247
-
248
-
249
-
250
-
251
-
252
-
253
-
254
-
255
-
256
-
257
-
258
-
259
-
260
-
261
-
262
-
263
-
264
-
265
-
266
-
267
-
268
-
269
-
270
-
271
-
272
-
273
-
274
-
275
-
276
-
277
-
278
-
279
-
280
-
281
-
282
-
283
-
284
-
285
-
286
-
287
-
288
-
289
-
290
-
291
-
292
-
293
-
294
-
295
-
296
-
297
-
298
-
299
-
300
-
301
-
302
-
303
-
304
-
305
-
306
-
307
-
308
-
309
-
310
-
311
-
312
-
313
-
314
-
315
-
316
-
317
-
318
-
319
-
320
-
321
-
322
-
323
-
324
-
325
-
326
-
327
-
328
-
329
-
330
-
331
-
332
-
333
-
334
-
335
-
336
-
337
-
338
-
339
-
340
-
341
-
342
-
343
-
344
-
345
-
346
-
347
-
348
-
349
-
350
-
351
-
352
-
353
-
354
-
355
-
356
-
357
-
358
-
359
-
360
-
361
-
362
-
363
-
364
-
365
-
366
-
367
-
368
-
369
-
370
-
371
-
372
-
373
-
374
-
375
-
376
-
377
-
378
-
379
-
380
-
381
-
382
-
383
-
384
-
385
-
386
-
387
-
388
-
389
-
390
-
391
-
392
-
393
-
394
-
395
-
396
-
397
-
398
-
399
-
400
-
401
-
402
-
403
-
404
-
405
-
406
-
407
-
408
-
409
-
410
-
411
-
412
-
413
-
414
-
415
-
416
-
417
-
418
-
419
-
420
-
421
-
422
-
423
-
424
-
425
-
426
-
427
-
428
-
429
-
430
-
431
-
432
-
433
-
434
-
435
-
436
-
437
-
438
-
439
-
440
-
441
-
442
-
443
-
444
-
445
-
446
-
447
-
448
-
449
-
450
-
451
-
452
-
453
-
454
-
455
-
456
-
457
-
458
 |
 |

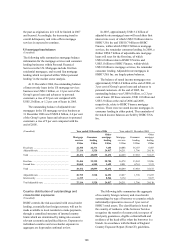
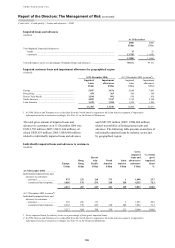
199
(Audited) 2005 (restated3)
Europe
Hong
Kong
Rest of
Asia-
Pacific
North
America
Latin
America
Total
US$m US$m US$m US$m US$m US$m
Impairment allowances at 1 January .................. 4,851 504 960 5,231 1,088 12,634
Amounts written off
Commercial, industrial and international trade (345) (157) (79) (81) (11) (673)
Real estate ....................................................... (67) (23) (11) (14) (2) (117)
Non-bank financial institutions ...................... (3) – – (10) – (13)
Other commercial ........................................... (108) – (6) (14) (66) (194)
Residential mortgages .................................... (14) (2) (6) (456) (30) (508)
Other personal ................................................ (2,267) (112) (227) (4,338) (594) (7,538)
(2,804) (294) (329) (4,913) (703) (9,043)
Recoveries of amounts written off in previous
years
Commercial, industrial and international trade 10 4 17 37 8 76
Real estate ....................................................... 5 – 1 2 1 9
Other commercial ........................................... 6 1 2 38 42 89
Residential mortgages .................................... 1 9 1 – 7 18
Other personal ................................................ 62 31 61 70 78 302
84 45 82 147 136 494
Net charge/(release) to income statement1
Banks .............................................................. (5) – (2) – – (7)
Commercial, industrial and international trade 354 199 (72) 32 75 588
Real estate ....................................................... 59 – 1 (6) 2 56
Non-bank financial institutions ...................... (14) (1) – 9 – (6)
Governments .................................................. 4 – – 2 – 6
Other commercial ........................................... (21) (32) (1) (18) 46 (26)
Residential mortgages .................................... 5 (25) 7 592 26 605
Other personal ................................................ 1,602 5 203 4,308 526 6,644
1,984 146 136 4,919 675 7,860
Foreign exchange and other movements ............ (616) (3) (12) (35) 87 (579)
Impairment allowances at 31 December ............ 3,499 398 837 5,349 1,283 11,366
Impairment allowances against banks:
– individually assessed ................................... 8 – 1 – – 9
Impairment allowances against customers:
– individually assessed ................................... 1,575 173 500 221 214 2,683
– collectively assessed2 .................................. 1,916 225 336 5,128 1,069 8,674
Impairment allowances at 31 December ............ 3,499 398 837 5,349 1,283 11,366
% % % % % %
Impairment allowances against customers
as a percentage of loans and advances to
customers:
– individually assessed ................................... 0.50 0.21 0.71 0.09 0.93 0.36
– collectively assessed .................................... 0.61 0.27 0.47 1.99 4.65 1.16
At 31 December .................................................. 1.11 0.48 1.18 2.08 5.58 1.52
1 See table below ‘Net impairment charge to income statement by geographical region’.
2 Collectively assessed impairment allowances are allocated to geographical segments based on the location of the office booking the
allowance. Consequently, the collectively assessed impairment allowances booked in Hong Kong may cover assets booked in branches
located outside Hong Kong, principally in the Rest of Asia-Pacific, as well as those booked in Hong Kong.
3 In 2006, Mexico and Panama were reclassified from the North America segment to the Latin America segment. Comparative
information has been restated accordingly. See Note 13 on the Financial Statements.