HSBC 2006 Annual Report Download - page 330
Download and view the complete annual report
Please find page 330 of the 2006 HSBC annual report below. You can navigate through the pages in the report by either clicking on the pages listed below, or by using the keyword search tool below to find specific information within the annual report.-
 1
1 -
2
-
3
-
4
-
5
-
6
-
7
-
8
-
9
-
10
-
11
-
12
-
13
-
14
-
15
-
16
-
17
-
18
-
19
-
20
-
21
-
22
-
23
-
24
-
25
-
26
-
27
-
28
-
29
-
30
-
31
-
32
-
33
-
34
-
35
-
36
-
37
-
38
-
39
-
40
-
41
-
42
-
43
-
44
-
45
-
46
-
47
-
48
-
49
-
50
-
51
-
52
-
53
-
54
-
55
-
56
-
57
-
58
-
59
-
60
-
61
-
62
-
63
-
64
-
65
-
66
-
67
-
68
-
69
-
70
-
71
-
72
-
73
-
74
-
75
-
76
-
77
-
78
-
79
-
80
-
81
-
82
-
83
-
84
-
85
-
86
-
87
-
88
-
89
-
90
-
91
-
92
-
93
-
94
-
95
-
96
-
97
-
98
-
99
-
100
-
101
-
102
-
103
-
104
-
105
-
106
-
107
-
108
-
109
-
110
-
111
-
112
-
113
-
114
-
115
-
116
-
117
-
118
-
119
-
120
-
121
-
122
-
123
-
124
-
125
-
126
-
127
-
128
-
129
-
130
-
131
-
132
-
133
-
134
-
135
-
136
-
137
-
138
-
139
-
140
-
141
-
142
-
143
-
144
-
145
-
146
-
147
-
148
-
149
-
150
-
151
-
152
-
153
-
154
-
155
-
156
-
157
-
158
-
159
-
160
-
161
-
162
-
163
-
164
-
165
-
166
-
167
-
168
-
169
-
170
-
171
-
172
-
173
-
174
-
175
-
176
-
177
-
178
-
179
-
180
-
181
-
182
-
183
-
184
-
185
-
186
-
187
-
188
-
189
-
190
-
191
-
192
-
193
-
194
-
195
-
196
-
197
-
198
-
199
-
200
-
201
-
202
-
203
-
204
-
205
-
206
-
207
-
208
-
209
-
210
-
211
-
212
-
213
-
214
-
215
-
216
-
217
-
218
-
219
-
220
-
221
-
222
-
223
-
224
-
225
-
226
-
227
-
228
-
229
-
230
-
231
-
232
-
233
-
234
-
235
-
236
-
237
-
238
-
239
-
240
-
241
-
242
-
243
-
244
-
245
-
246
-
247
-
248
-
249
-
250
-
251
-
252
-
253
-
254
-
255
-
256
-
257
-
258
-
259
-
260
-
261
-
262
-
263
-
264
-
265
-
266
-
267
-
268
-
269
-
270
-
271
-
272
-
273
-
274
-
275
-
276
-
277
-
278
-
279
-
280
-
281
-
282
-
283
-
284
-
285
-
286
-
287
-
288
-
289
-
290
-
291
-
292
-
293
-
294
-
295
-
296
-
297
-
298
-
299
-
300
-
301
-
302
-
303
-
304
-
305
-
306
-
307
-
308
-
309
-
310
-
311
-
312
-
313
-
314
-
315
-
316
-
317
-
318
-
319
-
 320
320 -
 321
321 -
 322
322 -
 323
323 -
 324
324 -
 325
325 -
 326
326 -
 327
327 -
 328
328 -
 329
329 -
 330
330 -
 331
331 -
 332
332 -
 333
333 -
 334
334 -
 335
335 -
 336
336 -
 337
337 -
 338
338 -
 339
339 -
 340
340 -
341
-
342
-
343
-
344
-
345
-
346
-
347
-
348
-
349
-
350
-
351
-
352
-
353
-
354
-
355
-
356
-
357
-
358
-
359
-
360
-
361
-
362
-
363
-
364
-
365
-
366
-
367
-
368
-
369
-
370
-
371
-
372
-
373
-
374
-
375
-
376
-
377
-
378
-
379
-
380
-
381
-
382
-
383
-
384
-
385
-
386
-
387
-
388
-
389
-
390
-
391
-
392
-
393
-
394
-
395
-
396
-
397
-
398
-
399
-
400
-
401
-
402
-
403
-
404
-
405
-
406
-
407
-
408
-
409
-
410
-
411
-
412
-
413
-
414
-
415
-
416
-
417
-
418
-
419
-
420
-
421
-
422
-
423
-
424
-
425
-
426
-
427
-
428
-
429
-
430
-
431
-
432
-
433
-
434
-
435
-
436
-
437
-
438
-
439
-
440
-
441
-
442
-
443
-
444
-
445
-
446
-
447
-
448
-
449
-
450
-
451
-
452
-
453
-
454
-
455
-
456
-
457
-
458
 |
 |

HSBC HOLDINGS PLC
Notes on the Financial Statements (continued)
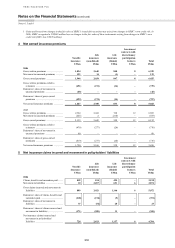
Note 7
328
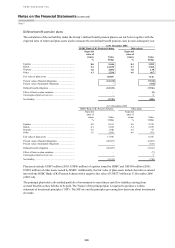
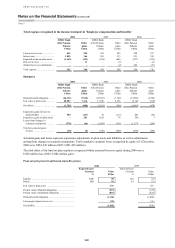
Total expense recognised in the income statement in ‘Employee compensation and benefits’
2006 2005 2004
HSBC Bank
(UK) Pension
Scheme
Other
plans
HSBC Bank
(UK) Pension
Scheme
Other
plans
HSBC Bank
(UK) Pension
Scheme
Other
plans
US$m US$m US$m US$m US$m US$m
Current service cost .................... 456 304 383 283 348 257
Interest cost ................................. 1,055 366 981 333 921 326
Expected return on plan assets ... (1,169) (421) (954) (401) (927) (382)
Past service cost .......................... – 11 – (3) – (8)
(Gains)/losses on curtailments .... – – – (4) 242 (17)
Total expense .............................. 342 260 410 208 584 176
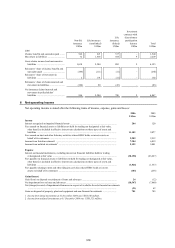
Summary
2006 2005 2004
HSBC Bank
(UK) Pension
Scheme
Other
plans
HSBC Bank
(UK) Pension
Scheme
Other
plans
HSBC Bank
(UK) Pension
Scheme
Other
plans
US$m US$m US$m US$m US$m US$m
Defined benefit obligation........... (24,332) (7,916) (20,587) (7,102) (19,988) (6,501)
Fair value of plan assets .............. 20,587 7,116 17,396 6,356 15,105 5,823
Net deficit ................................... (3,745) (800) (3,191) (746) (4,883) (678)
Experience gains/(losses) on
plan liabilities ......................... 540 (167) 70 (113) 401 (42)
Experience gains on plan assets . – 203 1,623 78 506 3
Losses from changes in
actuarial assumptions ............. (570) (44) (2,038) (393) (1,357) (243)
Total net actuarial gains/
(losses) .................................... (30) (8) (345) (428) (450) (282)
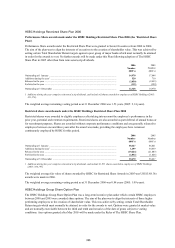
Actuarial gains and losses represent experience adjustments on plan assets and liabilities as well as adjustments
arising from changes in actuarial assumptions. Total cumulative actuarial losses recognised in equity at 31 December
2006 were US$1,543 million (2005: US$1,505 million).
The total effect of the limit on plan surpluses recognised within actuarial losses in equity during 2006 was a
US$2 million loss (2005: US$4 million gain).
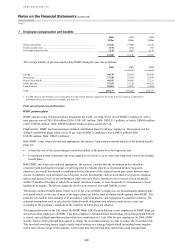
Post-employment healthcare benefits plans
2006 2005
Expected rates
of return Value
Expected rates
of return Value
% US$m
% US$m
Equities ......................................................................... 14.5 40
12.0 32
Bonds ............................................................................ 8.5 93
8.5 75
Fair value of plan assets ............................................... 133
107
Present value of funded obligations ............................. (219) (178)
Present value of unfunded obligations ......................... (887) (826)
Defined benefit obligation ............................................ (1,106) (1,004)
Unrecognised past service cost ..................................... (29) (31)
Net liability ................................................................... (1,002) (928)