HSBC 2006 Annual Report Download - page 121
Download and view the complete annual report
Please find page 121 of the 2006 HSBC annual report below. You can navigate through the pages in the report by either clicking on the pages listed below, or by using the keyword search tool below to find specific information within the annual report.-
 1
1 -
2
-
3
-
4
-
5
-
6
-
7
-
8
-
9
-
10
-
11
-
12
-
13
-
14
-
15
-
16
-
17
-
18
-
19
-
20
-
21
-
22
-
23
-
24
-
25
-
26
-
27
-
28
-
29
-
30
-
31
-
32
-
33
-
34
-
35
-
36
-
37
-
38
-
39
-
40
-
41
-
42
-
43
-
44
-
45
-
46
-
47
-
48
-
49
-
50
-
51
-
52
-
53
-
54
-
55
-
56
-
57
-
58
-
59
-
60
-
61
-
62
-
63
-
64
-
65
-
66
-
67
-
68
-
69
-
70
-
71
-
72
-
73
-
74
-
75
-
76
-
77
-
78
-
79
-
80
-
81
-
82
-
83
-
84
-
85
-
86
-
87
-
88
-
89
-
90
-
91
-
92
-
93
-
94
-
95
-
96
-
97
-
98
-
99
-
100
-
101
-
102
-
103
-
104
-
105
-
106
-
107
-
108
-
109
-
110
-
 111
111 -
 112
112 -
 113
113 -
 114
114 -
 115
115 -
 116
116 -
 117
117 -
 118
118 -
 119
119 -
 120
120 -
 121
121 -
 122
122 -
 123
123 -
 124
124 -
 125
125 -
 126
126 -
 127
127 -
 128
128 -
 129
129 -
 130
130 -
 131
131 -
132
-
133
-
134
-
135
-
136
-
137
-
138
-
139
-
140
-
141
-
142
-
143
-
144
-
145
-
146
-
147
-
148
-
149
-
150
-
151
-
152
-
153
-
154
-
155
-
156
-
157
-
158
-
159
-
160
-
161
-
162
-
163
-
164
-
165
-
166
-
167
-
168
-
169
-
170
-
171
-
172
-
173
-
174
-
175
-
176
-
177
-
178
-
179
-
180
-
181
-
182
-
183
-
184
-
185
-
186
-
187
-
188
-
189
-
190
-
191
-
192
-
193
-
194
-
195
-
196
-
197
-
198
-
199
-
200
-
201
-
202
-
203
-
204
-
205
-
206
-
207
-
208
-
209
-
210
-
211
-
212
-
213
-
214
-
215
-
216
-
217
-
218
-
219
-
220
-
221
-
222
-
223
-
224
-
225
-
226
-
227
-
228
-
229
-
230
-
231
-
232
-
233
-
234
-
235
-
236
-
237
-
238
-
239
-
240
-
241
-
242
-
243
-
244
-
245
-
246
-
247
-
248
-
249
-
250
-
251
-
252
-
253
-
254
-
255
-
256
-
257
-
258
-
259
-
260
-
261
-
262
-
263
-
264
-
265
-
266
-
267
-
268
-
269
-
270
-
271
-
272
-
273
-
274
-
275
-
276
-
277
-
278
-
279
-
280
-
281
-
282
-
283
-
284
-
285
-
286
-
287
-
288
-
289
-
290
-
291
-
292
-
293
-
294
-
295
-
296
-
297
-
298
-
299
-
300
-
301
-
302
-
303
-
304
-
305
-
306
-
307
-
308
-
309
-
310
-
311
-
312
-
313
-
314
-
315
-
316
-
317
-
318
-
319
-
320
-
321
-
322
-
323
-
324
-
325
-
326
-
327
-
328
-
329
-
330
-
331
-
332
-
333
-
334
-
335
-
336
-
337
-
338
-
339
-
340
-
341
-
342
-
343
-
344
-
345
-
346
-
347
-
348
-
349
-
350
-
351
-
352
-
353
-
354
-
355
-
356
-
357
-
358
-
359
-
360
-
361
-
362
-
363
-
364
-
365
-
366
-
367
-
368
-
369
-
370
-
371
-
372
-
373
-
374
-
375
-
376
-
377
-
378
-
379
-
380
-
381
-
382
-
383
-
384
-
385
-
386
-
387
-
388
-
389
-
390
-
391
-
392
-
393
-
394
-
395
-
396
-
397
-
398
-
399
-
400
-
401
-
402
-
403
-
404
-
405
-
406
-
407
-
408
-
409
-
410
-
411
-
412
-
413
-
414
-
415
-
416
-
417
-
418
-
419
-
420
-
421
-
422
-
423
-
424
-
425
-
426
-
427
-
428
-
429
-
430
-
431
-
432
-
433
-
434
-
435
-
436
-
437
-
438
-
439
-
440
-
441
-
442
-
443
-
444
-
445
-
446
-
447
-
448
-
449
-
450
-
451
-
452
-
453
-
454
-
455
-
456
-
457
-
458
 |
 |

119
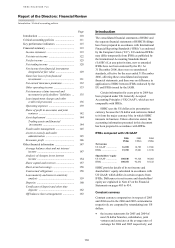
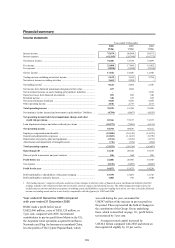
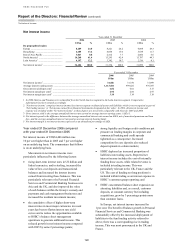
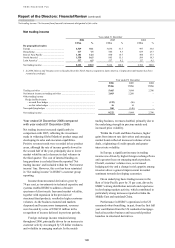
Financial summary
Income statement
Year ended 31 December
2006
US$m
2005
US$m
2004
US$m
Interest income ................................................................................................ 75,879 60,094 50,471
Interest expense ............................................................................................... (41,393) (28,760) (19,372)
Net interest income .......................................................................................... 34,486 31,334 31,099
Fee income ....................................................................................................... 21,080 17,486 15,902
Fee expense ...................................................................................................... (3,898) (3,030) (2,954)
Net fee income ................................................................................................. 17,182 14,456 12,948
Trading income excluding net interest income ............................................... 5,619 3,656 2,786
Net interest income on trading activities ......................................................... 2,603 2,208 –
Net trading income1 ......................................................................................... 8,222 5,864 2,786
Net income from financial instruments designated at fair value .................... 657 1,034 –
Net investment income on assets backing policyholders’ liabilities .............. – – 1,012
Gains less losses from financial investments .................................................. 969 692 540
Dividend income .............................................................................................. 340 155 622
Net earned insurance premiums ...................................................................... 5,668 5,436 5,368
Other operating income ................................................................................... 2,546 2,733 1,613
Total operating income ................................................................................. 70,070 61,704 55,988
Net insurance claims incurred and movement in policyholders’ liabilities .... (4,704) (4,067) (4,635)
Net operating income before loan impairment charges and other
credit risk provisions ................................................................................ 65,366 57,637 51,353
Loan impairment charges and other credit risk provisions ............................. (10,573) (7,801) (6,191)
Net operating income .................................................................................... 54,793 49,836 45,162
Employee compensation and benefits ............................................................. (18,500) (16,145) (14,523)
General and administrative expenses .............................................................. (12,823) (11,183) (9,739)
Depreciation of property, plant and equipment ............................................... (1,514) (1,632) (1,731)
Amortisation and impairment of intangible assets .......................................... (716) (554) (494)
Total operating expenses ............................................................................... (33,553) (29,514) (26,487)
Operating profit ............................................................................................. 21,240 20,322 18,675
Share of profit in associates and joint ventures ............................................... 846 644 268
Profit before tax ............................................................................................. 22,086 20,966 18,943
Tax expense ..................................................................................................... (5,215) (5,093) (4,685)
Profit for the year .......................................................................................... 16,871 15,873 14,258
Profit attributable to shareholders of the parent company .............................. 15,789 15,081 12,918
Profit attributable to minority interests ........................................................... 1,082 792 1,340
1 ‘Net trading income’ comprises all gains and losses from changes in the fair value of financial assets and financial liabilities held for
trading, together with related external interest income, interest expense and dividend income. The 2004 comparative figure does not
include interest income and interest expense on trading assets and liabilities except for trading derivatives, nor does it include dividend
income on trading assets and so is not strictly comparable with the figures for 2005 and 2006.
Year ended 31 December 2006 compared
with year ended 31 December 2005
HSBC made a profit before tax of
US$22,086 million, a rise of US$1,120 million, or
5 per cent, compared with 2005. Incremental
contributions to pre-tax profit from Metris in the US,
the Argentine retail operations acquired from Banca
Nazionale and Ping An Insurance in mainland China,
less the profits of The Cyprus Popular Bank, which
was sold during the year, accounted for
US$347 million of the increase in pre-tax profit in
the period. These represented the bulk of changes in
the constitution of the Group. On an underlying
basis, which is described on page 111, profit before
tax increased by 3 per cent.
Average invested capital increased by
US$10.6 billion compared with 2005 and return on
that capital fell slightly by 1.0 per cent to