HSBC 2006 Annual Report Download - page 210
Download and view the complete annual report
Please find page 210 of the 2006 HSBC annual report below. You can navigate through the pages in the report by either clicking on the pages listed below, or by using the keyword search tool below to find specific information within the annual report.-
 1
1 -
2
-
3
-
4
-
5
-
6
-
7
-
8
-
9
-
10
-
11
-
12
-
13
-
14
-
15
-
16
-
17
-
18
-
19
-
20
-
21
-
22
-
23
-
24
-
25
-
26
-
27
-
28
-
29
-
30
-
31
-
32
-
33
-
34
-
35
-
36
-
37
-
38
-
39
-
40
-
41
-
42
-
43
-
44
-
45
-
46
-
47
-
48
-
49
-
50
-
51
-
52
-
53
-
54
-
55
-
56
-
57
-
58
-
59
-
60
-
61
-
62
-
63
-
64
-
65
-
66
-
67
-
68
-
69
-
70
-
71
-
72
-
73
-
74
-
75
-
76
-
77
-
78
-
79
-
80
-
81
-
82
-
83
-
84
-
85
-
86
-
87
-
88
-
89
-
90
-
91
-
92
-
93
-
94
-
95
-
96
-
97
-
98
-
99
-
100
-
101
-
102
-
103
-
104
-
105
-
106
-
107
-
108
-
109
-
110
-
111
-
112
-
113
-
114
-
115
-
116
-
117
-
118
-
119
-
120
-
121
-
122
-
123
-
124
-
125
-
126
-
127
-
128
-
129
-
130
-
131
-
132
-
133
-
134
-
135
-
136
-
137
-
138
-
139
-
140
-
141
-
142
-
143
-
144
-
145
-
146
-
147
-
148
-
149
-
150
-
151
-
152
-
153
-
154
-
155
-
156
-
157
-
158
-
159
-
160
-
161
-
162
-
163
-
164
-
165
-
166
-
167
-
168
-
169
-
170
-
171
-
172
-
173
-
174
-
175
-
176
-
177
-
178
-
179
-
180
-
181
-
182
-
183
-
184
-
185
-
186
-
187
-
188
-
189
-
190
-
191
-
192
-
193
-
194
-
195
-
196
-
197
-
198
-
199
-
 200
200 -
 201
201 -
 202
202 -
 203
203 -
 204
204 -
 205
205 -
 206
206 -
 207
207 -
 208
208 -
 209
209 -
 210
210 -
 211
211 -
 212
212 -
 213
213 -
 214
214 -
 215
215 -
 216
216 -
 217
217 -
 218
218 -
 219
219 -
 220
220 -
221
-
222
-
223
-
224
-
225
-
226
-
227
-
228
-
229
-
230
-
231
-
232
-
233
-
234
-
235
-
236
-
237
-
238
-
239
-
240
-
241
-
242
-
243
-
244
-
245
-
246
-
247
-
248
-
249
-
250
-
251
-
252
-
253
-
254
-
255
-
256
-
257
-
258
-
259
-
260
-
261
-
262
-
263
-
264
-
265
-
266
-
267
-
268
-
269
-
270
-
271
-
272
-
273
-
274
-
275
-
276
-
277
-
278
-
279
-
280
-
281
-
282
-
283
-
284
-
285
-
286
-
287
-
288
-
289
-
290
-
291
-
292
-
293
-
294
-
295
-
296
-
297
-
298
-
299
-
300
-
301
-
302
-
303
-
304
-
305
-
306
-
307
-
308
-
309
-
310
-
311
-
312
-
313
-
314
-
315
-
316
-
317
-
318
-
319
-
320
-
321
-
322
-
323
-
324
-
325
-
326
-
327
-
328
-
329
-
330
-
331
-
332
-
333
-
334
-
335
-
336
-
337
-
338
-
339
-
340
-
341
-
342
-
343
-
344
-
345
-
346
-
347
-
348
-
349
-
350
-
351
-
352
-
353
-
354
-
355
-
356
-
357
-
358
-
359
-
360
-
361
-
362
-
363
-
364
-
365
-
366
-
367
-
368
-
369
-
370
-
371
-
372
-
373
-
374
-
375
-
376
-
377
-
378
-
379
-
380
-
381
-
382
-
383
-
384
-
385
-
386
-
387
-
388
-
389
-
390
-
391
-
392
-
393
-
394
-
395
-
396
-
397
-
398
-
399
-
400
-
401
-
402
-
403
-
404
-
405
-
406
-
407
-
408
-
409
-
410
-
411
-
412
-
413
-
414
-
415
-
416
-
417
-
418
-
419
-
420
-
421
-
422
-
423
-
424
-
425
-
426
-
427
-
428
-
429
-
430
-
431
-
432
-
433
-
434
-
435
-
436
-
437
-
438
-
439
-
440
-
441
-
442
-
443
-
444
-
445
-
446
-
447
-
448
-
449
-
450
-
451
-
452
-
453
-
454
-
455
-
456
-
457
-
458
 |
 |

HSBC HOLDINGS PLC
Report of the Directors: The Management of Risk (continued)
Credit risk > Impairment charges > 2005 / Loan delinquency in the US
208
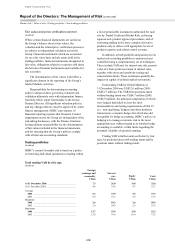
New loan impairment allowances in North
America declined by 6 per cent. This was despite
loan growth, and the additional credit allowances
raised in relation to hurricane Katrina, and
accelerated bankruptcy filings in the second half of
the year ahead of new legislation in the US. A
portion of the increase in bankruptcies was an
acceleration of write-offs that would have otherwise
been experienced in future periods. In an effort to
assist customers affected by hurricane Katrina,
HSBC initiated various programmes, including
extended payment arrangements. The reduction in
the charge also reflected the non-recurrence of a
US$47 million charge in 2004, following the
adoption of FFIEC write-off policies relating to
retail and credit card balances. Excluding these
factors, credit quality improved year on year,
reflecting an improving economic environment. This
contributed to the fall in new impairment
allowances, which was only partially offset by
increased requirements due to loan growth. HSBC
has benefited from the shift in the balance of the
consumer lending business towards higher credit
quality customers. HSBC Finance monitors the two-
month-and-over contractual delinquency ratio
closely, as management views it as an important
indicator of future write-offs. The ratio declined
from 4.0 per cent at 31 December 2004 to 3.6 per
cent at 30 June 2005, rising to 3.7 per cent at
31 December 2005. Lending in the US is primarily
in the personal sector. Credit quality in the
commercial portfolio was stable in 2005. The
favourable trends in the US were partially offset by
rises in new allowances in Canada which were
largely driven by personal loan growth in recent
years, with an improvement in underlying credit
quality.
Releases and recoveries in North America were
modestly lower than in 2005. Including the 2004
general provision release of US$45 million, releases
and recoveries declined by 31 per cent. In the US, a
rise in releases reflected an improved credit
environment and a strong economy. Under IFRSs,
from 1 January 2005 certain recoverable amounts
were incorporated into the loan impairment charge
directly resulting in lower reported recoveries. There
were further decreases in Bank of Bermuda,
following the non-recurrence of the general
provision release in 2004. These declines were offset
by a more than five-fold increase in releases in
Canada, where better credit quality was driven by
improved economic conditions, particularly in the
resource-driven economy of western Canada.
In Latin America, new impairment allowances
in Brazil were the principal cause of a 60 per cent
rise in new charges to US$898 million in 2005. In
Brazil, significant growth of 24 per cent in gross
advances, coupled with deteriorating credit quality in
the consumer finance business, were the main
contributing factors to this increase. Lending growth
combined with a move into the low-income segment,
where finances have been stretched by higher
interest rates, drove higher delinquency. Changes
were made to underwriting procedures during the
year, to improve the credit quality of new business.
This resulted in a falling impairment charge to asset
ratio towards the end of the year. In Mexico, new
allowances also rose, chiefly due to lending growth.
New allowances in Argentina were in line with
2004.
Releases and recoveries in Latin America were
broadly in line with 2004. Recoveries in Brazil rose
as a result of improved collections, compounded by
higher releases as a result of greater volumes of
advances. In Mexico, releases and recoveries
declined following the non-recurrence of a large
number of recoveries in 2004. Releases in Argentina
fell as impaired loans reduced. The combined fall in
Argentina and Mexico offset the rise in Brazil.