HSBC 2006 Annual Report Download - page 78
Download and view the complete annual report
Please find page 78 of the 2006 HSBC annual report below. You can navigate through the pages in the report by either clicking on the pages listed below, or by using the keyword search tool below to find specific information within the annual report.-
 1
1 -
2
-
3
-
4
-
5
-
6
-
7
-
8
-
9
-
10
-
11
-
12
-
13
-
14
-
15
-
16
-
17
-
18
-
19
-
20
-
21
-
22
-
23
-
24
-
25
-
26
-
27
-
28
-
29
-
30
-
31
-
32
-
33
-
34
-
35
-
36
-
37
-
38
-
39
-
40
-
41
-
42
-
43
-
44
-
45
-
46
-
47
-
48
-
49
-
50
-
51
-
52
-
53
-
54
-
55
-
56
-
57
-
58
-
59
-
60
-
61
-
62
-
63
-
64
-
65
-
66
-
67
-
 68
68 -
 69
69 -
 70
70 -
 71
71 -
 72
72 -
 73
73 -
 74
74 -
 75
75 -
 76
76 -
 77
77 -
 78
78 -
 79
79 -
 80
80 -
 81
81 -
 82
82 -
 83
83 -
 84
84 -
 85
85 -
 86
86 -
 87
87 -
 88
88 -
89
-
90
-
91
-
92
-
93
-
94
-
95
-
96
-
97
-
98
-
99
-
100
-
101
-
102
-
103
-
104
-
105
-
106
-
107
-
108
-
109
-
110
-
111
-
112
-
113
-
114
-
115
-
116
-
117
-
118
-
119
-
120
-
121
-
122
-
123
-
124
-
125
-
126
-
127
-
128
-
129
-
130
-
131
-
132
-
133
-
134
-
135
-
136
-
137
-
138
-
139
-
140
-
141
-
142
-
143
-
144
-
145
-
146
-
147
-
148
-
149
-
150
-
151
-
152
-
153
-
154
-
155
-
156
-
157
-
158
-
159
-
160
-
161
-
162
-
163
-
164
-
165
-
166
-
167
-
168
-
169
-
170
-
171
-
172
-
173
-
174
-
175
-
176
-
177
-
178
-
179
-
180
-
181
-
182
-
183
-
184
-
185
-
186
-
187
-
188
-
189
-
190
-
191
-
192
-
193
-
194
-
195
-
196
-
197
-
198
-
199
-
200
-
201
-
202
-
203
-
204
-
205
-
206
-
207
-
208
-
209
-
210
-
211
-
212
-
213
-
214
-
215
-
216
-
217
-
218
-
219
-
220
-
221
-
222
-
223
-
224
-
225
-
226
-
227
-
228
-
229
-
230
-
231
-
232
-
233
-
234
-
235
-
236
-
237
-
238
-
239
-
240
-
241
-
242
-
243
-
244
-
245
-
246
-
247
-
248
-
249
-
250
-
251
-
252
-
253
-
254
-
255
-
256
-
257
-
258
-
259
-
260
-
261
-
262
-
263
-
264
-
265
-
266
-
267
-
268
-
269
-
270
-
271
-
272
-
273
-
274
-
275
-
276
-
277
-
278
-
279
-
280
-
281
-
282
-
283
-
284
-
285
-
286
-
287
-
288
-
289
-
290
-
291
-
292
-
293
-
294
-
295
-
296
-
297
-
298
-
299
-
300
-
301
-
302
-
303
-
304
-
305
-
306
-
307
-
308
-
309
-
310
-
311
-
312
-
313
-
314
-
315
-
316
-
317
-
318
-
319
-
320
-
321
-
322
-
323
-
324
-
325
-
326
-
327
-
328
-
329
-
330
-
331
-
332
-
333
-
334
-
335
-
336
-
337
-
338
-
339
-
340
-
341
-
342
-
343
-
344
-
345
-
346
-
347
-
348
-
349
-
350
-
351
-
352
-
353
-
354
-
355
-
356
-
357
-
358
-
359
-
360
-
361
-
362
-
363
-
364
-
365
-
366
-
367
-
368
-
369
-
370
-
371
-
372
-
373
-
374
-
375
-
376
-
377
-
378
-
379
-
380
-
381
-
382
-
383
-
384
-
385
-
386
-
387
-
388
-
389
-
390
-
391
-
392
-
393
-
394
-
395
-
396
-
397
-
398
-
399
-
400
-
401
-
402
-
403
-
404
-
405
-
406
-
407
-
408
-
409
-
410
-
411
-
412
-
413
-
414
-
415
-
416
-
417
-
418
-
419
-
420
-
421
-
422
-
423
-
424
-
425
-
426
-
427
-
428
-
429
-
430
-
431
-
432
-
433
-
434
-
435
-
436
-
437
-
438
-
439
-
440
-
441
-
442
-
443
-
444
-
445
-
446
-
447
-
448
-
449
-
450
-
451
-
452
-
453
-
454
-
455
-
456
-
457
-
458
 |
 |

HSBC HOLDINGS PLC
Report of the Directors: Business Review (continued)
North America > 2006
76
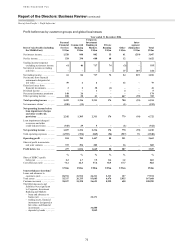
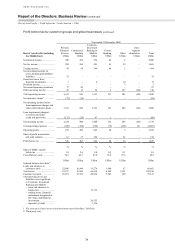
Profit before tax
Year ended 31 December
2006 20051 20041
North America US$m US$m US$m
Net interest income .......................................................................................... 14,268 13,295 13,787
Net fee income ................................................................................................. 4,766 3,952 3,197
Trading income ................................................................................................ 1,358 885 509
Net income/(expense) from financial instruments designated at fair value ... (63) 434 –
Net investment income from assets backing policyholders’ liabilities .......... – – –
Gains less losses from financial investments .................................................. 58 47 147
Dividend income .............................................................................................. 85 41 32
Net earned insurance premiums ...................................................................... 492 477 450
Other operating income ................................................................................... 922 642 341
Total operating income ................................................................................. 21,886 19,773 18,463
Net insurance claims incurred and movement in policyholders’ liabilities .... (259) (232) (236)
Net operating income before loan impairment charges and other
credit risk provisions ................................................................................. 21,627 19,541 18,227
Loan impairment charges and other credit risk provisions ............................. (6,796) (4,916) (5,036)
Net operating income .................................................................................... 14,831 14,625 13,191
Total operating expenses ................................................................................. (10,193) (8,758) (7,915)
Operating profit ............................................................................................. 4,638 5,867 5,276
Share of profit/(loss) in associates and joint ventures .................................... 30 48 (8)
Profit before tax ............................................................................................. 4,668 5,915 5,268
%
%
%
Share of HSBC’s profit before tax .................................................................. 21.1
28.2
27.8
Cost efficiency ratio ........................................................................................ 47.1
44.8
43.4
Year-end staff numbers (full-time equivalent) ................................................ 55,642 53,608 49,416
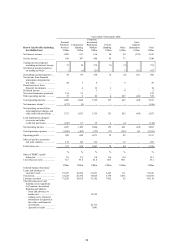
US$m US$m US$m
Selected balance sheet data2
Loans and advances to customers (net) ........................................................... 277,987 252,560 240,151
Loans and advances to banks (net) .................................................................. 17,865 10,331 20,911
Trading assets, financial instruments designated at fair value, and
financial investments3 .................................................................................
145,700 112,225 49,196
Total assets ...................................................................................................... 511,190 432,490 348,132
Deposits by banks ............................................................................................ 11,484 7,780 13,720
Customer accounts ........................................................................................... 120,922 111,386 117,551
1 In 2006, Mexico and Panama were reclassified from the North America segment to the Latin America segment. Comparative
information has been restated accordingly.
2 Third party only.
3 Including financial assets which may be repledged or resold by counterparties.
which, although showing signs of moderation,
remained strong throughout 2006. Although energy
prices eased, 2006’s commodity boom was expected
to continue benefiting the Canadian economy
through 2007. Inflation remained problematic with
core prices moving above the Bank of Canada’s
(‘BoC’) preferred target rate of 2 per cent, and
productivity remained relatively weak. Having raised
its overnight interest rate from 3.25 per cent at the
start of 2006 to 4.25 per cent in May, the BoC kept
rates on hold for the rest of the year.
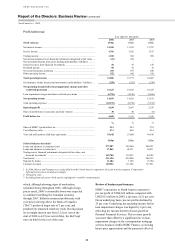
Review of business performance
HSBC’s operations in North America reported a
pre-tax profit of US$4,668 million compared with
US$5,915 million in 2005, a decrease of 21 per cent.
On an underlying basis, pre-tax profits declined by
25 per cent. Underlying net operating income before
loan impairment charges was higher by 6 per cent,
reflecting the income benefit of asset growth in
Personal Financial Services. This revenue growth
was more than offset by a significant rise in loan
impairment charges in the correspondent mortgage
services business within HSBC Finance, as slowing
house price appreciation and the projected effect of