HSBC 2006 Annual Report Download - page 196
Download and view the complete annual report
Please find page 196 of the 2006 HSBC annual report below. You can navigate through the pages in the report by either clicking on the pages listed below, or by using the keyword search tool below to find specific information within the annual report.-
 1
1 -
2
-
3
-
4
-
5
-
6
-
7
-
8
-
9
-
10
-
11
-
12
-
13
-
14
-
15
-
16
-
17
-
18
-
19
-
20
-
21
-
22
-
23
-
24
-
25
-
26
-
27
-
28
-
29
-
30
-
31
-
32
-
33
-
34
-
35
-
36
-
37
-
38
-
39
-
40
-
41
-
42
-
43
-
44
-
45
-
46
-
47
-
48
-
49
-
50
-
51
-
52
-
53
-
54
-
55
-
56
-
57
-
58
-
59
-
60
-
61
-
62
-
63
-
64
-
65
-
66
-
67
-
68
-
69
-
70
-
71
-
72
-
73
-
74
-
75
-
76
-
77
-
78
-
79
-
80
-
81
-
82
-
83
-
84
-
85
-
86
-
87
-
88
-
89
-
90
-
91
-
92
-
93
-
94
-
95
-
96
-
97
-
98
-
99
-
100
-
101
-
102
-
103
-
104
-
105
-
106
-
107
-
108
-
109
-
110
-
111
-
112
-
113
-
114
-
115
-
116
-
117
-
118
-
119
-
120
-
121
-
122
-
123
-
124
-
125
-
126
-
127
-
128
-
129
-
130
-
131
-
132
-
133
-
134
-
135
-
136
-
137
-
138
-
139
-
140
-
141
-
142
-
143
-
144
-
145
-
146
-
147
-
148
-
149
-
150
-
151
-
152
-
153
-
154
-
155
-
156
-
157
-
158
-
159
-
160
-
161
-
162
-
163
-
164
-
165
-
166
-
167
-
168
-
169
-
170
-
171
-
172
-
173
-
174
-
175
-
176
-
177
-
178
-
179
-
180
-
181
-
182
-
183
-
184
-
185
-
 186
186 -
 187
187 -
 188
188 -
 189
189 -
 190
190 -
 191
191 -
 192
192 -
 193
193 -
 194
194 -
 195
195 -
 196
196 -
 197
197 -
 198
198 -
 199
199 -
 200
200 -
 201
201 -
 202
202 -
 203
203 -
 204
204 -
 205
205 -
 206
206 -
207
-
208
-
209
-
210
-
211
-
212
-
213
-
214
-
215
-
216
-
217
-
218
-
219
-
220
-
221
-
222
-
223
-
224
-
225
-
226
-
227
-
228
-
229
-
230
-
231
-
232
-
233
-
234
-
235
-
236
-
237
-
238
-
239
-
240
-
241
-
242
-
243
-
244
-
245
-
246
-
247
-
248
-
249
-
250
-
251
-
252
-
253
-
254
-
255
-
256
-
257
-
258
-
259
-
260
-
261
-
262
-
263
-
264
-
265
-
266
-
267
-
268
-
269
-
270
-
271
-
272
-
273
-
274
-
275
-
276
-
277
-
278
-
279
-
280
-
281
-
282
-
283
-
284
-
285
-
286
-
287
-
288
-
289
-
290
-
291
-
292
-
293
-
294
-
295
-
296
-
297
-
298
-
299
-
300
-
301
-
302
-
303
-
304
-
305
-
306
-
307
-
308
-
309
-
310
-
311
-
312
-
313
-
314
-
315
-
316
-
317
-
318
-
319
-
320
-
321
-
322
-
323
-
324
-
325
-
326
-
327
-
328
-
329
-
330
-
331
-
332
-
333
-
334
-
335
-
336
-
337
-
338
-
339
-
340
-
341
-
342
-
343
-
344
-
345
-
346
-
347
-
348
-
349
-
350
-
351
-
352
-
353
-
354
-
355
-
356
-
357
-
358
-
359
-
360
-
361
-
362
-
363
-
364
-
365
-
366
-
367
-
368
-
369
-
370
-
371
-
372
-
373
-
374
-
375
-
376
-
377
-
378
-
379
-
380
-
381
-
382
-
383
-
384
-
385
-
386
-
387
-
388
-
389
-
390
-
391
-
392
-
393
-
394
-
395
-
396
-
397
-
398
-
399
-
400
-
401
-
402
-
403
-
404
-
405
-
406
-
407
-
408
-
409
-
410
-
411
-
412
-
413
-
414
-
415
-
416
-
417
-
418
-
419
-
420
-
421
-
422
-
423
-
424
-
425
-
426
-
427
-
428
-
429
-
430
-
431
-
432
-
433
-
434
-
435
-
436
-
437
-
438
-
439
-
440
-
441
-
442
-
443
-
444
-
445
-
446
-
447
-
448
-
449
-
450
-
451
-
452
-
453
-
454
-
455
-
456
-
457
-
458
 |
 |

HSBC HOLDINGS PLC
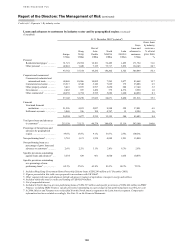
Report of the Directors: The Management of Risk (continued)
Credit risk > Credit quality > Loans and advances > 2006
194
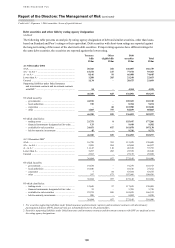
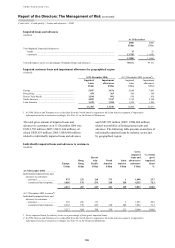
Impaired loans and advances
(Audited)
At 31 December
2006
US$m
2005
US$m
Total impaired loans and advances to:
– banks ........................................................................................................................................... 15 22
– customers .................................................................................................................................... 13,785 11,446
13,800 11,468
Total allowances cover as a percentage of impaired loans and advances ........................................ 98.4% 99.1%
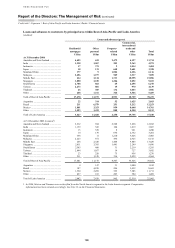
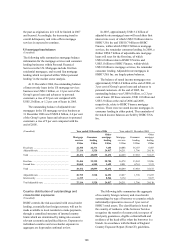
Impaired customer loans and impairment allowances by geographical region
(Audited)
At 31 December 2006 At 31 December 2005 (restated1)
Impaired
loans
Impairment
allowances
Impaired
loans
Impairment
allowances
US$m US$m US$m US$m
Europe ........................................................................... 5,847 3,676 5,068 3,491
Hong Kong ................................................................... 454 365 506 398
Rest of Asia-Pacific ...................................................... 1,184 901 936 836
North America .............................................................. 4,822 7,247 3,710 5,349
Latin America ............................................................... 1,478 1,389 1,226 1,283
13,785 13,578 11,446 11,357
1 In 2006, Mexico and Panama were reclassified from the North America segment to the Latin America segment. Comparative
information has been restated accordingly. See Note 13 on the Financial Statements.
The total gross amount of impaired loans and
advances to customers as at 31 December 2006 was
US$13,785 million (2005: US$11,446 million), of
which US$5,833 million (2005: US$4,960 million)
related to individually impaired loans and advances
and US$7,952 million (2005: US$6,486 million)
related to portfolios of homogeneous loans and
advances. The following table presents an analysis of
individually impaired loans by industry sector and
by geographical region:
Individually impaired loans and advances to customers
(Audited)
Europe
Hong
Kong
Rest of
Asia-
Pacific
North
America
Latin
America
Gross
impaired
loans and
advances to
customers
% of total
gross
impaired
loans1
US$m US$m US$m US$m US$m US$m %
At 31 December 2006 .................
Individually impaired loans and
advances to customers:
– personal ............................... 975 231 118 173 1 1,498 25.7
– commercial and corporate ... 3,056 176 531 248 324 4,335 74.3
4,031 407 649 421 325 5,833 100.0
At 31 December 2005 (restated2).
Individually impaired loans and
advances to customers:
– personal ............................... 655 256 119 – 5 1,035 20.9
– commercial and corporate ... 2,562 198 629 330 206 3,925 79.1
3,217 454 748 330 211 4,960 100.0
1 Gross impaired loans by industry sector as a percentage of total gross impaired loans.
2 In 2006, Mexico and Panama were reclassified from the North America segment to the Latin America segment. Comparative
information has been restated accordingly. See Note 13 on the Financial Statements.