HSBC 2006 Annual Report Download - page 128
Download and view the complete annual report
Please find page 128 of the 2006 HSBC annual report below. You can navigate through the pages in the report by either clicking on the pages listed below, or by using the keyword search tool below to find specific information within the annual report.-
 1
1 -
2
-
3
-
4
-
5
-
6
-
7
-
8
-
9
-
10
-
11
-
12
-
13
-
14
-
15
-
16
-
17
-
18
-
19
-
20
-
21
-
22
-
23
-
24
-
25
-
26
-
27
-
28
-
29
-
30
-
31
-
32
-
33
-
34
-
35
-
36
-
37
-
38
-
39
-
40
-
41
-
42
-
43
-
44
-
45
-
46
-
47
-
48
-
49
-
50
-
51
-
52
-
53
-
54
-
55
-
56
-
57
-
58
-
59
-
60
-
61
-
62
-
63
-
64
-
65
-
66
-
67
-
68
-
69
-
70
-
71
-
72
-
73
-
74
-
75
-
76
-
77
-
78
-
79
-
80
-
81
-
82
-
83
-
84
-
85
-
86
-
87
-
88
-
89
-
90
-
91
-
92
-
93
-
94
-
95
-
96
-
97
-
98
-
99
-
100
-
101
-
102
-
103
-
104
-
105
-
106
-
107
-
108
-
109
-
110
-
111
-
112
-
113
-
114
-
115
-
116
-
117
-
 118
118 -
 119
119 -
 120
120 -
 121
121 -
 122
122 -
 123
123 -
 124
124 -
 125
125 -
 126
126 -
 127
127 -
 128
128 -
 129
129 -
 130
130 -
 131
131 -
 132
132 -
 133
133 -
 134
134 -
 135
135 -
 136
136 -
 137
137 -
 138
138 -
139
-
140
-
141
-
142
-
143
-
144
-
145
-
146
-
147
-
148
-
149
-
150
-
151
-
152
-
153
-
154
-
155
-
156
-
157
-
158
-
159
-
160
-
161
-
162
-
163
-
164
-
165
-
166
-
167
-
168
-
169
-
170
-
171
-
172
-
173
-
174
-
175
-
176
-
177
-
178
-
179
-
180
-
181
-
182
-
183
-
184
-
185
-
186
-
187
-
188
-
189
-
190
-
191
-
192
-
193
-
194
-
195
-
196
-
197
-
198
-
199
-
200
-
201
-
202
-
203
-
204
-
205
-
206
-
207
-
208
-
209
-
210
-
211
-
212
-
213
-
214
-
215
-
216
-
217
-
218
-
219
-
220
-
221
-
222
-
223
-
224
-
225
-
226
-
227
-
228
-
229
-
230
-
231
-
232
-
233
-
234
-
235
-
236
-
237
-
238
-
239
-
240
-
241
-
242
-
243
-
244
-
245
-
246
-
247
-
248
-
249
-
250
-
251
-
252
-
253
-
254
-
255
-
256
-
257
-
258
-
259
-
260
-
261
-
262
-
263
-
264
-
265
-
266
-
267
-
268
-
269
-
270
-
271
-
272
-
273
-
274
-
275
-
276
-
277
-
278
-
279
-
280
-
281
-
282
-
283
-
284
-
285
-
286
-
287
-
288
-
289
-
290
-
291
-
292
-
293
-
294
-
295
-
296
-
297
-
298
-
299
-
300
-
301
-
302
-
303
-
304
-
305
-
306
-
307
-
308
-
309
-
310
-
311
-
312
-
313
-
314
-
315
-
316
-
317
-
318
-
319
-
320
-
321
-
322
-
323
-
324
-
325
-
326
-
327
-
328
-
329
-
330
-
331
-
332
-
333
-
334
-
335
-
336
-
337
-
338
-
339
-
340
-
341
-
342
-
343
-
344
-
345
-
346
-
347
-
348
-
349
-
350
-
351
-
352
-
353
-
354
-
355
-
356
-
357
-
358
-
359
-
360
-
361
-
362
-
363
-
364
-
365
-
366
-
367
-
368
-
369
-
370
-
371
-
372
-
373
-
374
-
375
-
376
-
377
-
378
-
379
-
380
-
381
-
382
-
383
-
384
-
385
-
386
-
387
-
388
-
389
-
390
-
391
-
392
-
393
-
394
-
395
-
396
-
397
-
398
-
399
-
400
-
401
-
402
-
403
-
404
-
405
-
406
-
407
-
408
-
409
-
410
-
411
-
412
-
413
-
414
-
415
-
416
-
417
-
418
-
419
-
420
-
421
-
422
-
423
-
424
-
425
-
426
-
427
-
428
-
429
-
430
-
431
-
432
-
433
-
434
-
435
-
436
-
437
-
438
-
439
-
440
-
441
-
442
-
443
-
444
-
445
-
446
-
447
-
448
-
449
-
450
-
451
-
452
-
453
-
454
-
455
-
456
-
457
-
458
 |
 |

HSBC HOLDINGS PLC
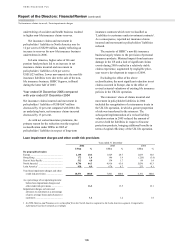
Report of the Directors: Financial Review (continued)
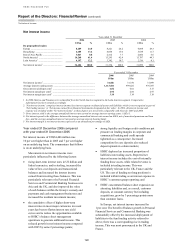
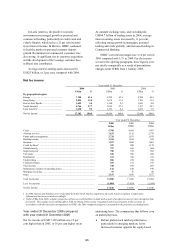
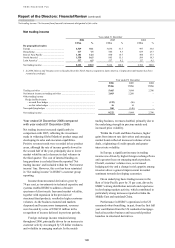
Net fee income
126
products. HSBC responded by launching new
investment products and increasing promotional
activity, which contributed to higher unit trust,
broking and custody fees.
• There was an increase in cards in issue, which
drove higher transaction volumes and balances
and led to a 16 per cent rise in card fee income,
principally in the US;
• Strong equity market performance also
benefited HSBC’s asset management activities.
Funds under management grew by 16 per cent
and performance fees rose strongly, most
notably in HSBC’s BRIC (Brazil, Russia, India
and China) funds and in the Hermitage Fund, a
leading fund investing in Russia.
• The successful promotion of packaged account
products which, together with increased
customer numbers and higher transaction
volumes, led to a 13 per cent rise in account
services fees. Higher cross-border currency
flows led to increased remittance income.
• Reduced sales of creditor insurance products in
the UK were largely offset by higher fees in
HSBC’s Latin American insurance businesses,
particularly in Argentina and Brazil.
• Increased taxpayer services fees, higher income
from investment and other services provided by
HSBC’s insurance businesses, and increased
corporate and WTAS advisory fees in the US
contributed to the increase in other fee income.
In Europe, account service fees increased as a
result of customer acquisition, higher sales of
packaged products and increased transaction
volumes. Rising stock markets led to higher sales of
investment products and growth in funds under
management, while product mix improvements and
service enhancements also contributed to a rise in
investment fees. Higher performance fees in respect
of the Hermitage Fund contributed an additional
US$23 million in fee income, net of performance
fees paid to the fund’s investment advisor. Offsetting
these increases, HSBC’s decision to constrain
unsecured lending growth in the UK resulted in
lower creditor protection insurance fees.
In Hong Kong, a buoyant IPO market together
with product launches and enhancements contributed
to higher sales of investment products; this was
augmented by increased transaction volumes
following strong growth in local and regional equity
markets. As global customers continued to seek
investment opportunities in emerging markets, funds
under management increased. Growth in cards in
issue led to higher card fees.
In the Rest of Asia-Pacific, higher trade and
remittance flows led to increased payments and cash
management income. Investment flows into
emerging market funds triggered growth in custody
and funds administration fees, while rising equity
markets and product launches contributed to
increased investor demand and higher income from
custody, brokerage and the sale of investments.
In North America, card fees increased as a result
of higher balances and improved interchange rates,
while private label card fees benefited from
renegotiations with a number of merchants.
Increases in 2006 were partly offset by the effect of
FFIEC guidance, which limits certain fee billings for
non-prime credit card accounts. Following its launch
in 2005, activity within HSBC’s mortgage-backed
securities business increased rapidly during 2006. As
a result, a greater proportion of loans originated by
HSBC were sold to the secondary market and
mortgage servicing fees grew accordingly, while
income in the mortgage-backed securities business
also rose. Tariff increases contributed to higher
account service fees. Higher business volumes led to
a rise in taxpayer services fees, while the WTAS
business progressed strongly, expanding its customer
base and reporting significantly higher fee income.
In Latin America, increased cards in circulation
and improvements in activation times led to higher
card issuing fees, while growth in the merchant
customer base led to a rise in card acquiring income.
Account servicing fees benefited from higher
packaged account sales, enhancements to other
current account products, price increases and greater
transaction volumes. The expansion of HSBC’s
ATM network in Mexico drove higher ATM fees.
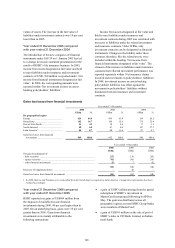
Year ended 31 December 2005 compared
with year ended 31 December 2004
Net fee income of US$14,456 million was
US$1,508 million or 12 per cent higher than in 2004.
Under IFRSs, a greater proportion of fees relating to
the provision of credit facilities is now amortised and
accounted for in net interest income as part of an
effective interest rate calculation than was the case
before 1 January 2005. This resulted in a reduction
in reported net fee income of approximately 4 per
cent. Excluding this effect and on an underlying
basis, growth in net fee income was 14 per cent and
the comments that follow are presented on this basis.
The principal drivers of this growth were:
• the increase in card fee income, reflecting strong
growth in personal credit card sales across the
Group and increased transaction volumes;