HSBC 2006 Annual Report Download - page 335
Download and view the complete annual report
Please find page 335 of the 2006 HSBC annual report below. You can navigate through the pages in the report by either clicking on the pages listed below, or by using the keyword search tool below to find specific information within the annual report.-
 1
1 -
2
-
3
-
4
-
5
-
6
-
7
-
8
-
9
-
10
-
11
-
12
-
13
-
14
-
15
-
16
-
17
-
18
-
19
-
20
-
21
-
22
-
23
-
24
-
25
-
26
-
27
-
28
-
29
-
30
-
31
-
32
-
33
-
34
-
35
-
36
-
37
-
38
-
39
-
40
-
41
-
42
-
43
-
44
-
45
-
46
-
47
-
48
-
49
-
50
-
51
-
52
-
53
-
54
-
55
-
56
-
57
-
58
-
59
-
60
-
61
-
62
-
63
-
64
-
65
-
66
-
67
-
68
-
69
-
70
-
71
-
72
-
73
-
74
-
75
-
76
-
77
-
78
-
79
-
80
-
81
-
82
-
83
-
84
-
85
-
86
-
87
-
88
-
89
-
90
-
91
-
92
-
93
-
94
-
95
-
96
-
97
-
98
-
99
-
100
-
101
-
102
-
103
-
104
-
105
-
106
-
107
-
108
-
109
-
110
-
111
-
112
-
113
-
114
-
115
-
116
-
117
-
118
-
119
-
120
-
121
-
122
-
123
-
124
-
125
-
126
-
127
-
128
-
129
-
130
-
131
-
132
-
133
-
134
-
135
-
136
-
137
-
138
-
139
-
140
-
141
-
142
-
143
-
144
-
145
-
146
-
147
-
148
-
149
-
150
-
151
-
152
-
153
-
154
-
155
-
156
-
157
-
158
-
159
-
160
-
161
-
162
-
163
-
164
-
165
-
166
-
167
-
168
-
169
-
170
-
171
-
172
-
173
-
174
-
175
-
176
-
177
-
178
-
179
-
180
-
181
-
182
-
183
-
184
-
185
-
186
-
187
-
188
-
189
-
190
-
191
-
192
-
193
-
194
-
195
-
196
-
197
-
198
-
199
-
200
-
201
-
202
-
203
-
204
-
205
-
206
-
207
-
208
-
209
-
210
-
211
-
212
-
213
-
214
-
215
-
216
-
217
-
218
-
219
-
220
-
221
-
222
-
223
-
224
-
225
-
226
-
227
-
228
-
229
-
230
-
231
-
232
-
233
-
234
-
235
-
236
-
237
-
238
-
239
-
240
-
241
-
242
-
243
-
244
-
245
-
246
-
247
-
248
-
249
-
250
-
251
-
252
-
253
-
254
-
255
-
256
-
257
-
258
-
259
-
260
-
261
-
262
-
263
-
264
-
265
-
266
-
267
-
268
-
269
-
270
-
271
-
272
-
273
-
274
-
275
-
276
-
277
-
278
-
279
-
280
-
281
-
282
-
283
-
284
-
285
-
286
-
287
-
288
-
289
-
290
-
291
-
292
-
293
-
294
-
295
-
296
-
297
-
298
-
299
-
300
-
301
-
302
-
303
-
304
-
305
-
306
-
307
-
308
-
309
-
310
-
311
-
312
-
313
-
314
-
315
-
316
-
317
-
318
-
319
-
320
-
321
-
322
-
323
-
324
-
 325
325 -
 326
326 -
 327
327 -
 328
328 -
 329
329 -
 330
330 -
 331
331 -
 332
332 -
 333
333 -
 334
334 -
 335
335 -
 336
336 -
 337
337 -
 338
338 -
 339
339 -
 340
340 -
 341
341 -
 342
342 -
 343
343 -
 344
344 -
 345
345 -
346
-
347
-
348
-
349
-
350
-
351
-
352
-
353
-
354
-
355
-
356
-
357
-
358
-
359
-
360
-
361
-
362
-
363
-
364
-
365
-
366
-
367
-
368
-
369
-
370
-
371
-
372
-
373
-
374
-
375
-
376
-
377
-
378
-
379
-
380
-
381
-
382
-
383
-
384
-
385
-
386
-
387
-
388
-
389
-
390
-
391
-
392
-
393
-
394
-
395
-
396
-
397
-
398
-
399
-
400
-
401
-
402
-
403
-
404
-
405
-
406
-
407
-
408
-
409
-
410
-
411
-
412
-
413
-
414
-
415
-
416
-
417
-
418
-
419
-
420
-
421
-
422
-
423
-
424
-
425
-
426
-
427
-
428
-
429
-
430
-
431
-
432
-
433
-
434
-
435
-
436
-
437
-
438
-
439
-
440
-
441
-
442
-
443
-
444
-
445
-
446
-
447
-
448
-
449
-
450
-
451
-
452
-
453
-
454
-
455
-
456
-
457
-
458
 |
 |

333
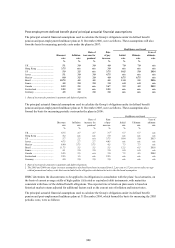
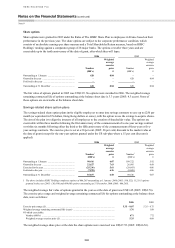
Expected dividends have been incorporated into the valuation model for options and shares, where applicable. The
expected US dollar denominated dividend growth was determined to be 9 per cent for the first year (2005: 12 per
cent) and 8 per cent thereafter (2005: 8 per cent), consistent with consensus analyst forecasts.
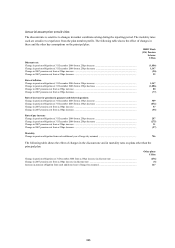
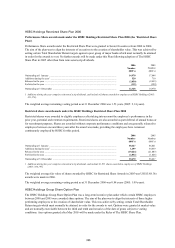
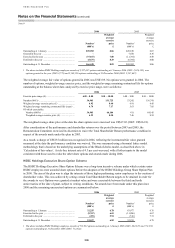
The HSBC Share Plan
The HSBC Share Plan was adopted by HSBC Holdings in 2005. Under this Plan Performance Share awards,
Restricted Share awards and Share Option awards may be made. The aim of The HSBC Share Plan is to align the
interests of executives to the creation of shareholder value and recognise individual performance and potential.
Awards are also made under this plan for recruitment and retention purposes.
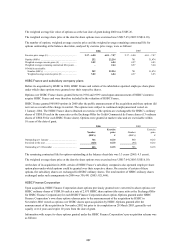
Performance Share awards
Performance Share awards are made to executive Directors and other senior executives taking into account individual
performance in the prior year. Performance Share awards are divided into two equal parts for testing attainment
against pre-determined benchmarking. One half of the award is subject to a Total Shareholder Return measure, based
on HSBC’s ranking against a comparator group of 28 major banks. The other half of the award is subject to an
earnings per share target. For each element of the award, shares would be released to the employee according to a
sliding scale from 30 to 100 per cent of the award, dependent upon the scale of achievement against the benchmarks
and provided that the minimum criteria for each performance measure has been met. Shares will be released after
three years to the extent that the performance conditions are satisfied.
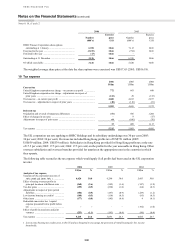
2006 2005
Number Number
(000’s) (000’s)
Outstanding at 1 January ................................................................................................................... 5,077 –
Additions during the year1.................................................................................................................. 5,312 5,077
Forfeited in the year ........................................................................................................................... (22) –
Outstanding at 31 December ............................................................................................................. 10,367 5,077
1 Additions during the year include 1,413,650 shares awarded to employees of HSBC Holdings (2005: 3,453,884).
The weighted average fair value of shares awarded by HSBC for Performance Share awards in 2006 was US$9.72
(2005: US$9.02).
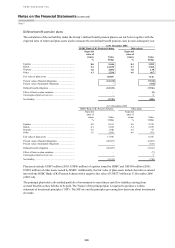
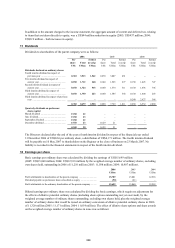
Restricted Share awards
Restricted Share awards are made to other employees based on performance, potential and retention requirements, for
recruitment or as part of deferral of annual bonus. The awards vest between one and three years from date of award.
2006 2005
Number Number
(000’s) (000’s)
Outstanding at 1 January ................................................................................................................... 5,106 –
Additions during the year1.................................................................................................................. 41,440 5,285
Released in the year ........................................................................................................................... (1,685) (179)
Forfeited in the year ........................................................................................................................... (1,441) –
Outstanding at 31 December ............................................................................................................. 43,420 5,106
1 Additions during the year include 324,884 shares awarded to employees of HSBC Holdings (2005: 823).
The weighted average fair value of shares awarded by HSBC for Restricted Share Awards in 2006 was US$17.65
(2005: US$16.66).