HSBC 2006 Annual Report Download - page 34
Download and view the complete annual report
Please find page 34 of the 2006 HSBC annual report below. You can navigate through the pages in the report by either clicking on the pages listed below, or by using the keyword search tool below to find specific information within the annual report.-
 1
1 -
2
-
3
-
4
-
5
-
6
-
7
-
8
-
9
-
10
-
11
-
12
-
13
-
14
-
15
-
16
-
17
-
18
-
19
-
20
-
21
-
22
-
23
-
 24
24 -
 25
25 -
 26
26 -
 27
27 -
 28
28 -
 29
29 -
 30
30 -
 31
31 -
 32
32 -
 33
33 -
 34
34 -
 35
35 -
 36
36 -
 37
37 -
 38
38 -
 39
39 -
 40
40 -
 41
41 -
 42
42 -
 43
43 -
 44
44 -
45
-
46
-
47
-
48
-
49
-
50
-
51
-
52
-
53
-
54
-
55
-
56
-
57
-
58
-
59
-
60
-
61
-
62
-
63
-
64
-
65
-
66
-
67
-
68
-
69
-
70
-
71
-
72
-
73
-
74
-
75
-
76
-
77
-
78
-
79
-
80
-
81
-
82
-
83
-
84
-
85
-
86
-
87
-
88
-
89
-
90
-
91
-
92
-
93
-
94
-
95
-
96
-
97
-
98
-
99
-
100
-
101
-
102
-
103
-
104
-
105
-
106
-
107
-
108
-
109
-
110
-
111
-
112
-
113
-
114
-
115
-
116
-
117
-
118
-
119
-
120
-
121
-
122
-
123
-
124
-
125
-
126
-
127
-
128
-
129
-
130
-
131
-
132
-
133
-
134
-
135
-
136
-
137
-
138
-
139
-
140
-
141
-
142
-
143
-
144
-
145
-
146
-
147
-
148
-
149
-
150
-
151
-
152
-
153
-
154
-
155
-
156
-
157
-
158
-
159
-
160
-
161
-
162
-
163
-
164
-
165
-
166
-
167
-
168
-
169
-
170
-
171
-
172
-
173
-
174
-
175
-
176
-
177
-
178
-
179
-
180
-
181
-
182
-
183
-
184
-
185
-
186
-
187
-
188
-
189
-
190
-
191
-
192
-
193
-
194
-
195
-
196
-
197
-
198
-
199
-
200
-
201
-
202
-
203
-
204
-
205
-
206
-
207
-
208
-
209
-
210
-
211
-
212
-
213
-
214
-
215
-
216
-
217
-
218
-
219
-
220
-
221
-
222
-
223
-
224
-
225
-
226
-
227
-
228
-
229
-
230
-
231
-
232
-
233
-
234
-
235
-
236
-
237
-
238
-
239
-
240
-
241
-
242
-
243
-
244
-
245
-
246
-
247
-
248
-
249
-
250
-
251
-
252
-
253
-
254
-
255
-
256
-
257
-
258
-
259
-
260
-
261
-
262
-
263
-
264
-
265
-
266
-
267
-
268
-
269
-
270
-
271
-
272
-
273
-
274
-
275
-
276
-
277
-
278
-
279
-
280
-
281
-
282
-
283
-
284
-
285
-
286
-
287
-
288
-
289
-
290
-
291
-
292
-
293
-
294
-
295
-
296
-
297
-
298
-
299
-
300
-
301
-
302
-
303
-
304
-
305
-
306
-
307
-
308
-
309
-
310
-
311
-
312
-
313
-
314
-
315
-
316
-
317
-
318
-
319
-
320
-
321
-
322
-
323
-
324
-
325
-
326
-
327
-
328
-
329
-
330
-
331
-
332
-
333
-
334
-
335
-
336
-
337
-
338
-
339
-
340
-
341
-
342
-
343
-
344
-
345
-
346
-
347
-
348
-
349
-
350
-
351
-
352
-
353
-
354
-
355
-
356
-
357
-
358
-
359
-
360
-
361
-
362
-
363
-
364
-
365
-
366
-
367
-
368
-
369
-
370
-
371
-
372
-
373
-
374
-
375
-
376
-
377
-
378
-
379
-
380
-
381
-
382
-
383
-
384
-
385
-
386
-
387
-
388
-
389
-
390
-
391
-
392
-
393
-
394
-
395
-
396
-
397
-
398
-
399
-
400
-
401
-
402
-
403
-
404
-
405
-
406
-
407
-
408
-
409
-
410
-
411
-
412
-
413
-
414
-
415
-
416
-
417
-
418
-
419
-
420
-
421
-
422
-
423
-
424
-
425
-
426
-
427
-
428
-
429
-
430
-
431
-
432
-
433
-
434
-
435
-
436
-
437
-
438
-
439
-
440
-
441
-
442
-
443
-
444
-
445
-
446
-
447
-
448
-
449
-
450
-
451
-
452
-
453
-
454
-
455
-
456
-
457
-
458
 |
 |

HSBC HOLDINGS PLC
Report of the Directors: Business Review (continued)
Europe > 2006
32
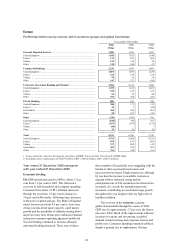
Profit before tax
Year ended 31 December
Europe
2006
US$m
2005
US$m
2004
US$m
Net interest income .......................................................................................... 8,289 8,221 9,098
Net fee income ................................................................................................. 7,108 6,299 5,980
Net trading income .......................................................................................... 4,529 3,036 997
Net income from financial instruments designated at fair value .................... 144 362 –
Net investment income on assets backing policyholders’ liabilities .............. – – 571
Gains less losses from financial investments .................................................. 624 439 154
Dividend income .............................................................................................. 183 63 558
Net earned insurance premiums ...................................................................... 1,298 1,599 1,875
Other operating income ................................................................................... 1,428 1,603 1,175
Total operating income ................................................................................. 23,603 21,622 20,408
Net insurance claims incurred and movement in policyholders’ liabilities .... (531) (818) (1,628)
Net operating income before loan impairment charges and other
credit risk provisions ................................................................................ 23,072 20,804 18,780
Loan impairment charges and other credit risk provisions ............................. (2,155) (1,929) (1,033)
Net operating income .................................................................................... 20,917 18,875 17,747
Total operating expenses ................................................................................. (13,871) (12,639) (12,028)
Operating profit ............................................................................................. 7,046 6,236 5,719
Share of profit/(loss) in associates and joint ventures .................................... (72) 120 37
Profit before tax ............................................................................................. 6,974 6,356 5,756
% % %
Share of HSBC’s profit before tax ........................................................................ 31.5 30.3 30.4
Cost efficiency ratio .............................................................................................. 60.1 60.8 64.0
Year-end staff numbers (full-time equivalent) ...................................................... 78,311 77,755 74,861
US$m US$m US$m
Selected balance sheet data1
Loans and advances to customers (net) ................................................................. 392,499 312,537 277,560
Loans and advances to banks (net) ........................................................................ 76,830 44,360 56,049
Trading assets, financial instruments designated at fair value and
financial investments2 ....................................................................................... 242,010
146,777 139,183
Total assets ............................................................................................................ 828,701 636,703 545,557
Deposits by banks .................................................................................................. 67,821 47,202 55,720
Customer accounts ................................................................................................. 419,365 334,200 292,568
1 Third party only.
2 Including financial assets which may be repledged or resold by counterparties.
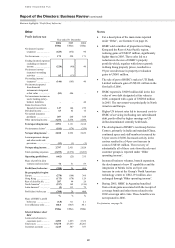
growth improved sharply, while growth in France
and Italy was less impressive. Eurozone inflation
was heavily affected by rises in energy and food
prices. Inflation, excluding energy and food,
remained contained at just 1.7 per cent. The
European Central Bank (‘ECB’) increased the key
policy interest rate from 2.25 per cent at the
beginning of 2006 to 3.5 per cent in December. The
ECB continued to describe monetary policy as
‘accommodative’, thereby effectively ending the
year with a bias towards tightening.
Turkey’s economy slowed markedly in the
third quarter, with year-on-year GDP growth of
3.4 per cent, down from 7.8 per cent in the second
quarter. The current account deficit continued to
widen, reaching 8 per cent of GDP in December,
partly from high-energy prices but also from the
increasing substitution of imported materials for
local ones due to the overvalued currency. More than
half of the deficit was financed by healthy foreign
direct investment inflows. The International
Monetary Fund’s programme for Turkey remained
on track.
Review of business performance
European operations reported a pre-tax profit
of US$6,974 million compared with
US$6,356 million in 2005, an increase of 10 per