HSBC 2006 Annual Report Download - page 342
Download and view the complete annual report
Please find page 342 of the 2006 HSBC annual report below. You can navigate through the pages in the report by either clicking on the pages listed below, or by using the keyword search tool below to find specific information within the annual report.-
 1
1 -
2
-
3
-
4
-
5
-
6
-
7
-
8
-
9
-
10
-
11
-
12
-
13
-
14
-
15
-
16
-
17
-
18
-
19
-
20
-
21
-
22
-
23
-
24
-
25
-
26
-
27
-
28
-
29
-
30
-
31
-
32
-
33
-
34
-
35
-
36
-
37
-
38
-
39
-
40
-
41
-
42
-
43
-
44
-
45
-
46
-
47
-
48
-
49
-
50
-
51
-
52
-
53
-
54
-
55
-
56
-
57
-
58
-
59
-
60
-
61
-
62
-
63
-
64
-
65
-
66
-
67
-
68
-
69
-
70
-
71
-
72
-
73
-
74
-
75
-
76
-
77
-
78
-
79
-
80
-
81
-
82
-
83
-
84
-
85
-
86
-
87
-
88
-
89
-
90
-
91
-
92
-
93
-
94
-
95
-
96
-
97
-
98
-
99
-
100
-
101
-
102
-
103
-
104
-
105
-
106
-
107
-
108
-
109
-
110
-
111
-
112
-
113
-
114
-
115
-
116
-
117
-
118
-
119
-
120
-
121
-
122
-
123
-
124
-
125
-
126
-
127
-
128
-
129
-
130
-
131
-
132
-
133
-
134
-
135
-
136
-
137
-
138
-
139
-
140
-
141
-
142
-
143
-
144
-
145
-
146
-
147
-
148
-
149
-
150
-
151
-
152
-
153
-
154
-
155
-
156
-
157
-
158
-
159
-
160
-
161
-
162
-
163
-
164
-
165
-
166
-
167
-
168
-
169
-
170
-
171
-
172
-
173
-
174
-
175
-
176
-
177
-
178
-
179
-
180
-
181
-
182
-
183
-
184
-
185
-
186
-
187
-
188
-
189
-
190
-
191
-
192
-
193
-
194
-
195
-
196
-
197
-
198
-
199
-
200
-
201
-
202
-
203
-
204
-
205
-
206
-
207
-
208
-
209
-
210
-
211
-
212
-
213
-
214
-
215
-
216
-
217
-
218
-
219
-
220
-
221
-
222
-
223
-
224
-
225
-
226
-
227
-
228
-
229
-
230
-
231
-
232
-
233
-
234
-
235
-
236
-
237
-
238
-
239
-
240
-
241
-
242
-
243
-
244
-
245
-
246
-
247
-
248
-
249
-
250
-
251
-
252
-
253
-
254
-
255
-
256
-
257
-
258
-
259
-
260
-
261
-
262
-
263
-
264
-
265
-
266
-
267
-
268
-
269
-
270
-
271
-
272
-
273
-
274
-
275
-
276
-
277
-
278
-
279
-
280
-
281
-
282
-
283
-
284
-
285
-
286
-
287
-
288
-
289
-
290
-
291
-
292
-
293
-
294
-
295
-
296
-
297
-
298
-
299
-
300
-
301
-
302
-
303
-
304
-
305
-
306
-
307
-
308
-
309
-
310
-
311
-
312
-
313
-
314
-
315
-
316
-
317
-
318
-
319
-
320
-
321
-
322
-
323
-
324
-
325
-
326
-
327
-
328
-
329
-
330
-
331
-
 332
332 -
 333
333 -
 334
334 -
 335
335 -
 336
336 -
 337
337 -
 338
338 -
 339
339 -
 340
340 -
 341
341 -
 342
342 -
 343
343 -
 344
344 -
 345
345 -
 346
346 -
 347
347 -
 348
348 -
 349
349 -
 350
350 -
 351
351 -
 352
352 -
353
-
354
-
355
-
356
-
357
-
358
-
359
-
360
-
361
-
362
-
363
-
364
-
365
-
366
-
367
-
368
-
369
-
370
-
371
-
372
-
373
-
374
-
375
-
376
-
377
-
378
-
379
-
380
-
381
-
382
-
383
-
384
-
385
-
386
-
387
-
388
-
389
-
390
-
391
-
392
-
393
-
394
-
395
-
396
-
397
-
398
-
399
-
400
-
401
-
402
-
403
-
404
-
405
-
406
-
407
-
408
-
409
-
410
-
411
-
412
-
413
-
414
-
415
-
416
-
417
-
418
-
419
-
420
-
421
-
422
-
423
-
424
-
425
-
426
-
427
-
428
-
429
-
430
-
431
-
432
-
433
-
434
-
435
-
436
-
437
-
438
-
439
-
440
-
441
-
442
-
443
-
444
-
445
-
446
-
447
-
448
-
449
-
450
-
451
-
452
-
453
-
454
-
455
-
456
-
457
-
458
 |
 |

HSBC HOLDINGS PLC
Notes on the Financial Statements (continued)
Notes 12 and 13
340
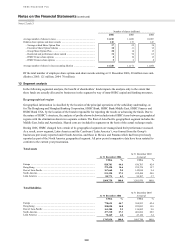
Number of shares (millions)
2006 2005 2004
Average number of shares in issue .................................................................. 11,210 11,038 10,907
Dilutive share options and share awards ......................................................... 110 133 147
– Savings-related Share Option Plan .......................................................... 27 22 38
– Executive Share Option Scheme .............................................................. 10 11 12
– Group Share Option Plan ......................................................................... 28 14 13
– Restricted and performance share awards ................................................ 32 70 63
– HSBC France share options ..................................................................... 8 10 13
– HSBC Finance share options ................................................................... 5 6 8
Average number of shares in issue assuming dilution .................................... 11,320 11,171 11,054
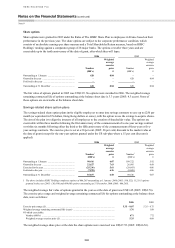
Of the total number of employee share options and share awards existing at 31 December 2006, 20 million were anti-
dilutive (2005: 121 million; 2004: 70 million).
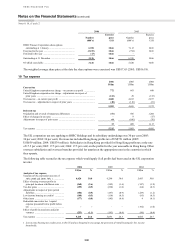
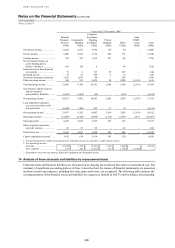
13 Segment analysis
In the following segmental analysis, the benefit of shareholders’ funds impacts the analysis only to the extent that
these funds are actually allocated to businesses in the segment by way of intra-HSBC capital and funding structures.
By geographical region
Geographical information is classified by the location of the principal operations of the subsidiary undertaking, or,
for The Hongkong and Shanghai Banking Corporation, HSBC Bank, HSBC Bank Middle East, HSBC Finance and
HSBC Bank USA, by the location of the branch responsible for reporting the results or advancing the funds. Due to
the nature of HSBC’s structure, the analysis of profits shown below includes intra-HSBC items between geographical
regions with the elimination shown in a separate column. The Rest of Asia-Pacific geographical segment includes the
Middle East, India and Australasia. Shared costs are included in segments on the basis of the actual recharges made.
During 2006, HSBC changed how certain of its geographical segments are managed and their performance assessed.
As a result, a new segment, Latin America and the Carribean (‘Latin America’), was formed from the Group’s
businesses previously reported under South America, and those in Mexico and Panama which had been previously
reported as part of the North America geographical segment. All prior period comparative data have been restated to
conform to the current year presentation.
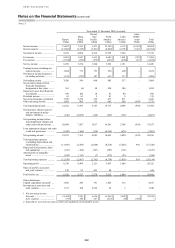
Total assets
At 31 December 2006
At 31 December 2005
(restated)
US$m % US$m %
Europe .............................................................................................................. 828,701 44.6 636,703 42.4
Hong Kong ...................................................................................................... 272,428 14.6 235,376 15.7
Rest of Asia-Pacific ......................................................................................... 167,668 9.0 142,014 9.4
North America ................................................................................................. 511,190 27.5 432,490 28.8
Latin America .................................................................................................. 80,771 4.3 55,387 3.7
1,860,758 100.0 1,501,970 100.0
Total liabilities
At 31 December 2006
At 31 December 2005
(restated)
US$m % US$m %
Europe .............................................................................................................. 778,635 44.7 594,953 42.4
Hong Kong ...................................................................................................... 258,028 14.8 223,093 15.9
Rest of Asia-Pacific ......................................................................................... 161,388 9.2 136,892 9.8
North America ................................................................................................. 477,310 27.3 401,686 28.5
Latin America .................................................................................................. 70,469 4.0 47,120 3.4
1,745,830 100.0 1,403,744 100.0