HSBC 2006 Annual Report Download - page 53
Download and view the complete annual report
Please find page 53 of the 2006 HSBC annual report below. You can navigate through the pages in the report by either clicking on the pages listed below, or by using the keyword search tool below to find specific information within the annual report.-
 1
1 -
2
-
3
-
4
-
5
-
6
-
7
-
8
-
9
-
10
-
11
-
12
-
13
-
14
-
15
-
16
-
17
-
18
-
19
-
20
-
21
-
22
-
23
-
24
-
25
-
26
-
27
-
28
-
29
-
30
-
31
-
32
-
33
-
34
-
35
-
36
-
37
-
38
-
39
-
40
-
41
-
42
-
 43
43 -
 44
44 -
 45
45 -
 46
46 -
 47
47 -
 48
48 -
 49
49 -
 50
50 -
 51
51 -
 52
52 -
 53
53 -
 54
54 -
 55
55 -
 56
56 -
 57
57 -
 58
58 -
 59
59 -
 60
60 -
 61
61 -
 62
62 -
 63
63 -
64
-
65
-
66
-
67
-
68
-
69
-
70
-
71
-
72
-
73
-
74
-
75
-
76
-
77
-
78
-
79
-
80
-
81
-
82
-
83
-
84
-
85
-
86
-
87
-
88
-
89
-
90
-
91
-
92
-
93
-
94
-
95
-
96
-
97
-
98
-
99
-
100
-
101
-
102
-
103
-
104
-
105
-
106
-
107
-
108
-
109
-
110
-
111
-
112
-
113
-
114
-
115
-
116
-
117
-
118
-
119
-
120
-
121
-
122
-
123
-
124
-
125
-
126
-
127
-
128
-
129
-
130
-
131
-
132
-
133
-
134
-
135
-
136
-
137
-
138
-
139
-
140
-
141
-
142
-
143
-
144
-
145
-
146
-
147
-
148
-
149
-
150
-
151
-
152
-
153
-
154
-
155
-
156
-
157
-
158
-
159
-
160
-
161
-
162
-
163
-
164
-
165
-
166
-
167
-
168
-
169
-
170
-
171
-
172
-
173
-
174
-
175
-
176
-
177
-
178
-
179
-
180
-
181
-
182
-
183
-
184
-
185
-
186
-
187
-
188
-
189
-
190
-
191
-
192
-
193
-
194
-
195
-
196
-
197
-
198
-
199
-
200
-
201
-
202
-
203
-
204
-
205
-
206
-
207
-
208
-
209
-
210
-
211
-
212
-
213
-
214
-
215
-
216
-
217
-
218
-
219
-
220
-
221
-
222
-
223
-
224
-
225
-
226
-
227
-
228
-
229
-
230
-
231
-
232
-
233
-
234
-
235
-
236
-
237
-
238
-
239
-
240
-
241
-
242
-
243
-
244
-
245
-
246
-
247
-
248
-
249
-
250
-
251
-
252
-
253
-
254
-
255
-
256
-
257
-
258
-
259
-
260
-
261
-
262
-
263
-
264
-
265
-
266
-
267
-
268
-
269
-
270
-
271
-
272
-
273
-
274
-
275
-
276
-
277
-
278
-
279
-
280
-
281
-
282
-
283
-
284
-
285
-
286
-
287
-
288
-
289
-
290
-
291
-
292
-
293
-
294
-
295
-
296
-
297
-
298
-
299
-
300
-
301
-
302
-
303
-
304
-
305
-
306
-
307
-
308
-
309
-
310
-
311
-
312
-
313
-
314
-
315
-
316
-
317
-
318
-
319
-
320
-
321
-
322
-
323
-
324
-
325
-
326
-
327
-
328
-
329
-
330
-
331
-
332
-
333
-
334
-
335
-
336
-
337
-
338
-
339
-
340
-
341
-
342
-
343
-
344
-
345
-
346
-
347
-
348
-
349
-
350
-
351
-
352
-
353
-
354
-
355
-
356
-
357
-
358
-
359
-
360
-
361
-
362
-
363
-
364
-
365
-
366
-
367
-
368
-
369
-
370
-
371
-
372
-
373
-
374
-
375
-
376
-
377
-
378
-
379
-
380
-
381
-
382
-
383
-
384
-
385
-
386
-
387
-
388
-
389
-
390
-
391
-
392
-
393
-
394
-
395
-
396
-
397
-
398
-
399
-
400
-
401
-
402
-
403
-
404
-
405
-
406
-
407
-
408
-
409
-
410
-
411
-
412
-
413
-
414
-
415
-
416
-
417
-
418
-
419
-
420
-
421
-
422
-
423
-
424
-
425
-
426
-
427
-
428
-
429
-
430
-
431
-
432
-
433
-
434
-
435
-
436
-
437
-
438
-
439
-
440
-
441
-
442
-
443
-
444
-
445
-
446
-
447
-
448
-
449
-
450
-
451
-
452
-
453
-
454
-
455
-
456
-
457
-
458
 |
 |
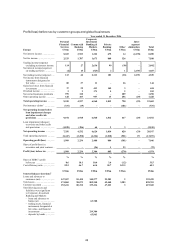
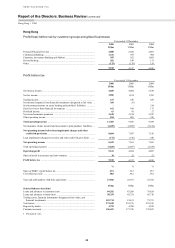
51
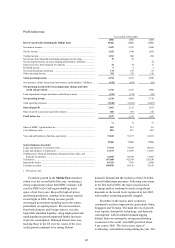
capitalise on cross-border financing opportunities
between Hong Kong, mainland China, Taiwan and
Vietnam was instrumental in contributing to the
growth in mid-market lending balances.
Growth in small business lending was facilitated
through a streamlined lending process and the
adoption of a new credit scorecard. As a result, the
number of small business customers borrowing from
HSBC increased by 12 per cent and small business
lending balances rose by 9 per cent. Increased
competition led to a 12 basis point narrowing of
asset spreads.
Net fee income of US$454 million was 13 per
cent higher than in 2005. Cash management and
remittance fees increased by 18 per cent, driven by
growth in the number of current account customers,
enhancements to the product range and increased
cross-border remittances. Robust local equity
markets prompted the launch of 88 new investment
products amid resurgent demand. Sales of unit trusts
were consequently 15 per cent higher, while
derivative and structured product sales rose by
83 per cent.
The establishment of a new Commercial
Banking insurance business in October 2005
contributed to life insurance policy sales more than
doubling and an 18 per cent rise in non-life policies
in force. As a result, insurance fee income more than
doubled and premium income increased by 23 per
cent.
Effective promotion contributed to a 31 per cent
rise in receivables finance fee income, while
increased hedging activity and a rise in the value of
multi-currency transactions by Commercial Banking
customers contributed to a 57 per cent increase in
treasury income.
The transfer of the majority of HSBC’s card
acquiring business into a joint venture with Global
Payments Inc. realised a gain of US$13 million for
Commercial Banking, reported in ‘Other operating
income’. Fee income in HSBC’s remaining card
acquiring business not included in the transfer rose
by 43 per cent, reflecting an increase in the number
of merchant customers and higher transaction values.
Loan impairment charges decreased by 59 per
cent, principally due to the non-recurrence of
significant charges against a single client in 2005.
Credit quality remained strong and non-performing
loans as a proportion of lending balances fell by
22 basis points to 62 basis points, reflecting prudent
lending policies and risk mitigation procedures.
Operating expenses increased by 17 per cent to
US$491 million to support the strong revenue
opportunities evident in the market. The recruitment
of additional sales and support staff and the
development of the Commercial Banking insurance
business contributed to higher staff numbers which,
together with the effect of pay rises, resulted in
higher staff costs. Marketing costs rose as HSBC
stepped up its advertising and promotional activity,
including the launch of the global Commercial
Banking campaign to build market share. Cost
efficiency was improved by the continuing migration
of sales and transaction activity to lower-cost direct
channels.
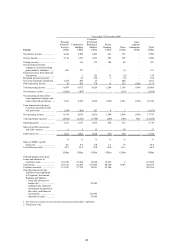
Corporate, Investment Banking and Markets
reported a pre-tax profit of US$955 million, an
increase of 3 per cent compared with 2005. Global
Markets performance remained robust, with
encouraging revenue growth in areas in which
HSBC has invested, complemented by strong
income growth in the securities services business.
The cost efficiency ratio increased slightly, primarily
due to the first full year effect of various growth
initiatives taken in 2005.
Total operating income of US$1,849 million
was 7 per cent higher. Although balance sheet
management reported an overall decline, revenues
recovered modestly in the second half of 2006 as
lower yielding positions matured. In Global
Banking, net interest income from payments and
cash management activity rose sharply as a 6 per
cent increase in deposits was complemented by
wider spreads. Revenues benefited from improved
customer flows following the launch of services
offered through HSBCnet in the latter part of 2005.
Income from lending activities decreased as the
benefit of higher lending balances was more than
offset by the effect of spread compression resulting
from an abundance of credit in a highly competitive
market.
Net fee income rose by 24 per cent. HSBC
Securities Services reported a 28 per cent increase in
fees as buoyant stock markets drove higher customer
activity. Debt underwriting volumes increased as
tightening credit spreads encouraged issuers to lock
in to the favourable credit environment by extending
the term of finance or by raising new debt in local
markets. By contrast, equity underwriting fees
declined.
Group Investment Businesses used HSBC’s
extensive distribution network to take advantage of
the global trend of strong investment flows to
emerging markets. Higher fees reflected strong
performance fees from HSBC’s emerging market
funds. Client funds under management grew by
23 per cent to US$35 billion, as HSBC launched new